I’ve been remiss with blogging the past couple of months, mostly because I’ve been involved in several pretty cool projects that have been keeping me busy. As I mentioned in yesterday’s post, I recently wrote a paper for Flowable about end-to-end automation and the business model transformation that it enabled.
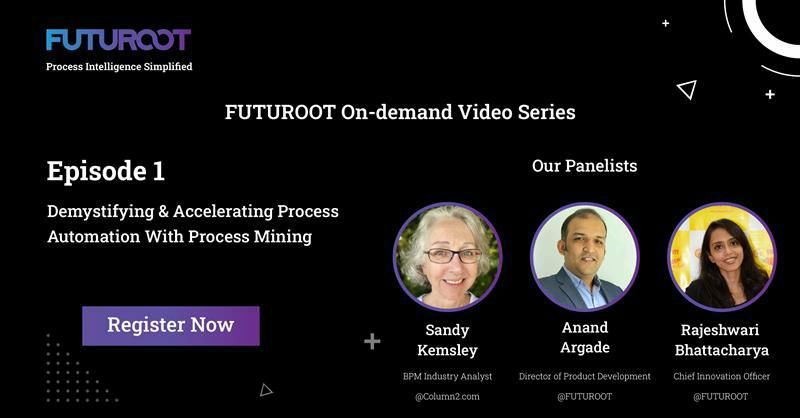
I’ve been working on a video series for a process mining startup, Futuroot, which specializes in process intelligence for SAP systems. We’re doing these as conversational videos between me and a couple of the Futuroot team, each video about 20 minutes of free-ranging conversation. In the first episode, I talk with Rajee Bhattacharyya, Futuroot’s Chief Innovation Officer, and Anand Argade, their Director of Product Development. Here’s a short teaser from the video:
You can sign up here to watch the entire video and be notified of the future ones as they are published. We’ve just recorded the second one, so watch for that coming out soon.
Back in 2008, I started attending the annual academic research BPM conference, which was in Milan that year. I’m not an academic, but this wasn’t just an excuse for a week in Europe: the presentations I saw there generated so many ideas about the direction that the industry would/should take. Coincidentally, 2008 was also the first year that I saw process mining offered as a product: I had a demo with Keith Swenson of Fujitsu showing me their process discovery product/service in June, then saw Anne Rozinat’s presentation at the academic conference in September (she was still at Eindhoven University then, but went on to create Fluxicon and their process mining tool).
Over the years, I met a lot of people at this conference who accepted me as a bit of a curiosity; I brought the conference some amount of publicity through my blog posts, and pushed a lot of software vendors to start showing up to see the wild and wonderful ideas on display. They even invited me to give a keynote in 2011 on the changing nature of work. Two of the people who I met along the way, Marlon Dumas of University of Tartu and Marcello La Rosa of University of Melbourne, went on to form their own process mining company, Apromore.
I’ve recently written a white paper for Apromore to help demystify the use of process mining alongside more traditional process modeling techniques by business analysts. From the introduction:
Process modeling and process mining are complementary, not competitive, techniques: a business analyst needs both in their toolkit. Process mining provides exact models of the system-based portions of processes, while manual modeling and analysis captures human activities, documents informal procedures, and identifies the many ways that people “work around” systems.
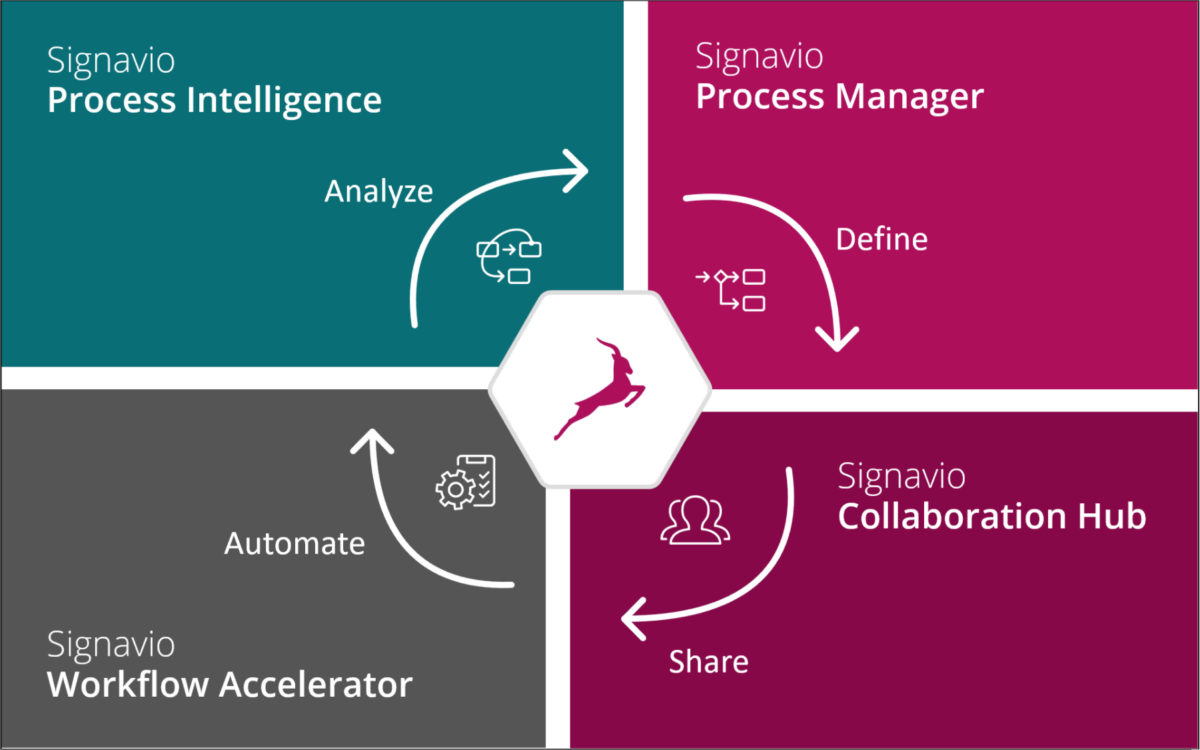
I first met Signavio CEO Gero Decker in 2008, when he was a researcher at Hasso Platner Institut and emailed me about promoting their BPMN poster — a push to have BPMN (then version 1.1) recognized as a standard for process modeling. I attended the academic BPM conference in Milan that year but Gero wasn’t able to attend, although his name was on a couple of that year’s modeling-related demo sessions and papers related to Oryx, an open source process modeling project. By the 2009 conference in Ulm we finally met face-to-face, where he told me about what he was working on, process modeling ideas that would eventually evolve into Signavio. By the 2010 BPM conference in Hoboken, he was showing me a Signavio demo, and we ended up running into each other at many other BPM events over the years, as well as having many online briefings as they released new products. The years of hard work that he and his team have put into Signavio have paid off this week with the announcement of Signavio’s impending acquisition by SAP (Signavio press release, SAP press release). There have been rumors floating around for a couple of days, and this morning I had the chance for a quick chat with Gero in advance of the official announcement.
The combination of business process intelligence from SAP and Signavio creates a leading end-to-end business process transformation suite to help our customers achieve the requirements needed to gain a competitive edge.
Luka Mucic, CFO of SAP
SAP is launching RISE with SAP today, with the Signavio acquisition a part of the announcement. RISE with SAP is billed as “business transformation as a service”, providing business process redesign (including Signavio), technical migration (which appears to be a push to get reluctant customers onto their current platform), and building an intelligent enterprise (which is mostly a cloud infrastructure message).
This is a full company acquisition, including all Signavio employees (numbering about 500). Gero and the only other co-founder still at Signavio, CTO Willi Tscheschner, will continue in their roles to drive forward the product vision and implementation, becoming part of SAP’s relatively new Business Process Intelligence unit, which is directly under the executive board. Since that unit previously contained about 100 people, the Signavio acquisition will swell those ranks considerably, and Gero will co-lead the unit with the existing GM, Rouven Morato. A long-time SAP employee, Morato can no doubt help navigate the sometimes murky organizational waters that might otherwise trip up a newcomer. Morato was also a significant force in SAP’s own internal transformation through analytics and process intelligence, moving them from the dinosaur of old to a (relatively) more nimble and responsive company, hence understands the importance of products like Signavio’s in transforming large organizations.
Existing Signavio customers probably won’t see much difference right now. Over time, capabilities from SAP will become integrated into the process intelligence suite, such as deeper integration to introspect and analyze SAP S/4 processes. Eventually product names and SKUs will change, but as long as Gero is involved, you can expect the same laser focus on linking customer experience and actions back to processes. The potential customer base for Signavio will broaden considerably, especially as they start to offer dashboards that collect information on processes that include, but are not limited to, the SAP suite. In the past, SAP has been very focused on providing “best practice” processes within their suite; however, if there’s anything that this past year of pandemic-driven disruption has taught us, those best practices aren’t always best for every organization, and processes always include things outside of SAP. Having a broader view of end-to-end processes will help organizations in their digital transformations.
Obviously, this is going to have an impact on SAP’s current partnership with Celonis, since the SAP Process Mining by Celonis would be directly in competition with Signavio’s Process Intelligence. Of course, Signavio also has a long history with SAP, but their partnership has not been as tightly branded as the Celonis arrangement. Until now. Celonis arguably has a stronger process mining product than Signavio, especially with their launch into task mining, and have a long history of working with SAP customers on their process improvement. There’s always room for partners that provide different functionality even if somewhat in competition with an internal functionality, but Celonis will need to build a strong case for why a SAP customer should pick them over the Signavio-based, SAP-branded process intelligence offering.
Keep in mind that SAP hasn’t had a great track record of process products that aren’t part of their core suite: remember SAP NetWeaver BPM? Yeah, I didn’t think so. However, Signavio’s products are focused on modeling and analyzing processes, not automating them, so they might have a better chance of being positioned as discovering improvements to processes that are automated in the core suite, as well as giving SAP more visibility into how their customers’ businesses run outside of the SAP suite. There’s definitely great potential here, but also the risk of just becoming buried within SAP — time will tell.
Disclosure: Signavio has been a client of mine within the last year for creating a series of webinars. I was not compensated in any way for writing this post (or anything else on this blog, for that matter), and it represents my own opinions.
The key to designing metrics and incentives is to figure out the problems that the workers are there to solve, which are often tied in some way to customer satisfaction, then use that to derive performance metrics and employee incentives.
There are a lot of challenges with figuring out how to measure and reward experience and innovative thinking: if it’s done wrong, then companies end up measuring how long you spent with a particular app open on your screen, or how many times you clicked on your keyboard.
We’re going through a lot of process disruption right now, and smart companies are using this opportunity to retool the way that they do things. They also need to be thinking about how their employee incentives are lined up with that redesign, and whether business goals are being served appropriately.
Last week, I was busy preparing and presenting to webinars for twodifferent clients, so I ended up missing Software AG’s ARIS international user groups (IUG) conference and most of Fluxicon’s Process Mining Camp online conference, although I did catch a bit of the Lufthansa presentation. However, Process Mining Camp continues this week, giving me a chance to tune in for the remaining sessions. The format is interesting, there is only one presentation each day, presented live using YouTube Live (no registration required), with some Q&A at the end. The next day starts with Process Mining Café, which is an extended Q&A with the previous day’s presenter based on the conversations in the related Slack workspace (which you do need to register to join), then a break before moving on to that day’s presentation. The presentations are available on YouTube almost as soon as they are finished, but are being shared via Slack using unlisted links, so I’ll let Fluxicon make them public at their own pace (subscribe to their YouTube channel since they will likely end up there).
Anne Rozinat, co-founder of Fluxicon, was moderator for the event, and was able to bring life to the Q&A since she’s an expert in the subject matter and had questions of her own. Each day’s session runs a maximum of two hours starting at 10am Eastern, which makes it a reasonable time for all of Europe and North America (having lived in California, I know the west coasters are used to getting up for 7am events to sync with east coast times). Also, each presentation is a practitioner who uses process mining (specifically, Fluxicon’s Disco product) in real applications, meaning that they have stories to share about their data analysis, and what worked and didn’t work.
Monday started with Q&A with Zsolt Varga of the European Court of Auditors, who presented last Friday. It was a great discussion and made me want to go back and see Varga’s presentation: he had some interesting comments on how they track and resolve missing historical data, as well as one of the more interesting backgrounds. There was then a presentation by Hilda Klasky of the Oak Ridge National Laboratory on process mining for electronic health records with some cool data clustering and abstraction to extract case management state transition patterns from what seemed to be a massive spaghetti mess. Tuesday, Klasky returned for Q&A, then a presentation by Harm Hoebergen and Redmar Draaisma of Freo (an online loans subsidiary of Rabobank) on loan and credit processes across multiple channels. It was great to track Slack during a presentation and see the back-and-forth conversations as well as watch the questions accumulate for the presenter; after each presentation, it was common to see the presenter respond to questions and discussion points that weren’t covered in the live Q&A. For online conferences, this type of “chaotic engagement” (rather than tightly controlled broadcasts from the vendor, or non-functionality single-threaded chat streams) replaces the “hallway chats” and is essential for turning a non-engaging set of online presentations into a more immersive conference experience.
The conference closing keynote today was by Wil van der Aalst, who headed the process mining group at Eindhoven University of Technology where Fluxicon’s co-founders did their Ph.D. studies. He’s now at RWTH Aachen University, although remains affiliated with Eindhoven. I’ve had the pleasure of meeting van der Aalst several times at the academic/research BPM conferences (including last year in Vienna), and always enjoy hearing him present. He spoke about some of the latest research in object-centric process mining, which addresses the issue of handling events that refer to multiple business objects, such as multiple items in a single order that may be split into multiple deliveries. Traditionally in process mining, each event record from a history log that forms the process mining data has a single case ID, plus a timestamp and an activity name. But what happens if an event impacts multiple cases?
He started with an overview of process mining and many of the existing challenges, such as performance issues with conformance checking, and the fact that data collection/cleansing still takes 80% of the effort. However, process mining (and, I believe, task mining as a secondary method of data collection) can be using event logs where an event refers to multiple cases, requiring that the data be “flattened” to pick one of the cases as the identifier for the event record, then duplicate the record for each case referred to in the event. The problem arises because events can disappear when cases are merged again, which will cause problems in generating accurate process models. Consider your standard Amazon order, like the one that I’m waiting for right now. I placed a single order containing eight items a couple of days ago, which were supposed to be delivered in a single shipment tomorrow. However, the single order was split into three separate orders the day after I placed the order, then two of the orders are being sent in a single shipment that is arriving today, while the third order will be in its own shipment tomorrow. Think about the complexity of tracking by order, or item, or shipment: processes diverge and converge in these many-to-many relationships. Is this one process (my original order), or two (shipments), or three (final orders)?
The really great part was engaging in the Slack discussion while the keynote was going on. A few people were asking questions (including me), and Mieke Jans posted a link to a post that she wrote on a procedure for cleansing event logs for multi-case processes – not the same as what van der Aalst was talking about, but a related topic. Anne Rozinat posted a link to more reading on these types of many-to-many situations in the context of their process mining product from their “Process Mining in Practice” online book. Not surprisingly, there was almost no discussion on the Twitter hashtag, since the attendees had a proper discussion platform; contrast this with some of the other conferences where attendees had to resort to Twitter to have a conversation about the content. After the keynote, van der Aalst even joined in the discussion and answered a few questions, plus added the link for the IEEE task force on process mining that promotes research, development, education and understanding of process mining: definitely of interest if you want to get plugged into more of the research in the field. As a special treat, Ferry Timp created visual notes for each day and posted them to the related Slack channel – you can see the one from today at the left.
Great keynote and discussion afterwards, I recommend tracking Fluxicon’s blog and/or YouTube channel to watch it – and all of the other presentations – when published.
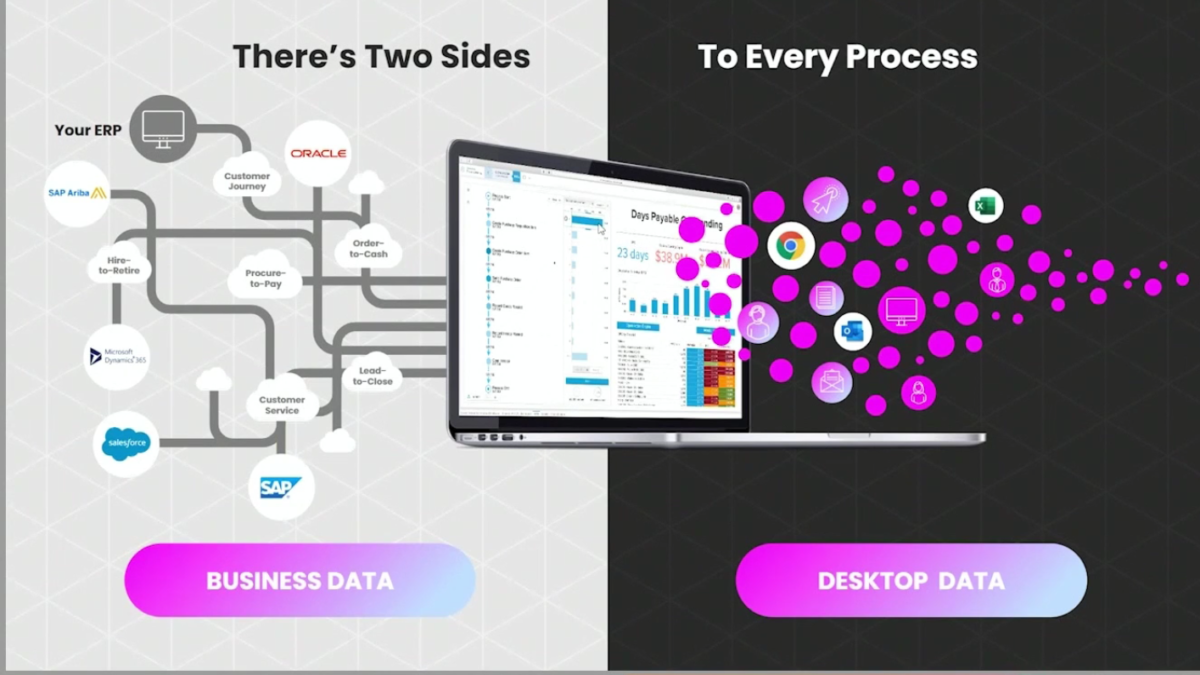
Traditionally, process mining is fed from history logs from a single system. However, most businesses aren’t run on a single system, and Celonis Product Lead for Discovery Sabeth Steiner discussed how they are allowing multi-event log process mining, where logs from multiple systems are ingested and correlated to do a more comprehensive analysis. This can be useful to find friction between parallel (inbound) procurement and (outbound) sales processes, or customer service requests that span multiple process silos. Different parallel processes appear in Celonis process discovery in different colors, and the crossover points between them highlighted.
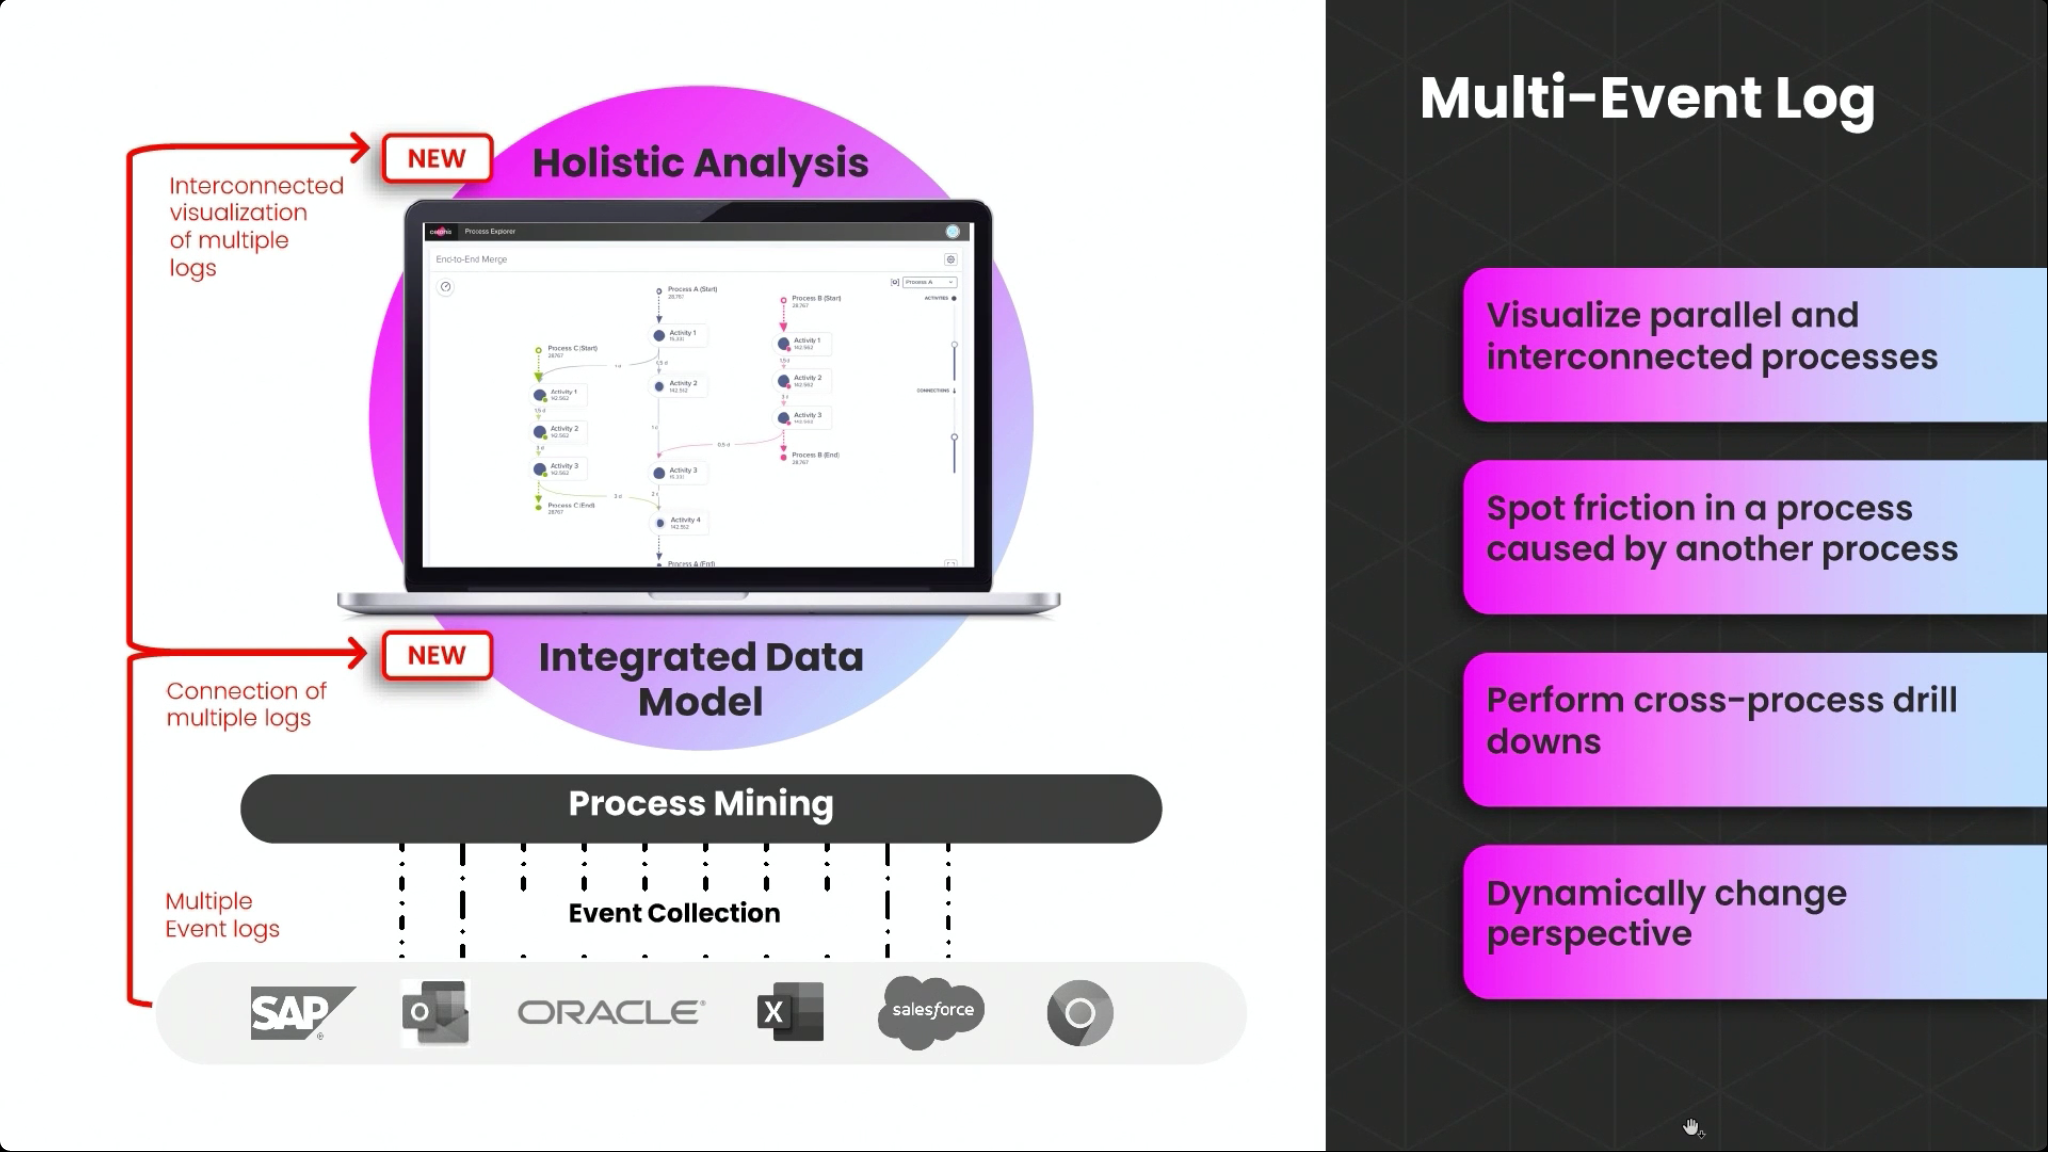
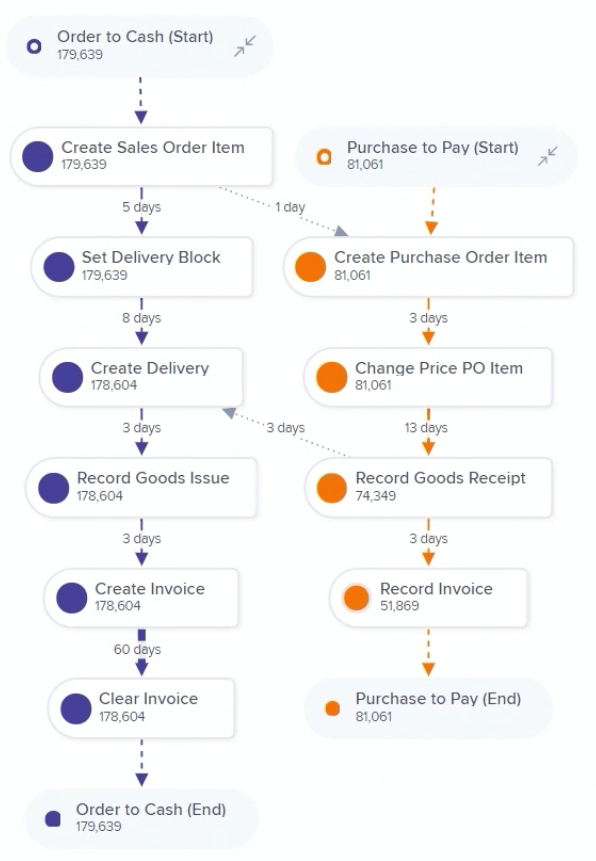
Each of the processes can be analyzed independently, but the power comes when they are analyzed in tandem: optimizing the delivery time within an order-to-cash process while seeing the points that it interacts with the procure-to-pay process of the vendors providing materials for that order. Jessica Kaufmann, Senior Software Developer, joined Steiner to show the integrated data model that exists behind the integrated analysis of multiple processes, and how to set this up for multiple event logs. She discussed the different types of visualization: whether to visualize the different processes as a single process (by merging the event logs), or as multiple interacting processes. KPIs can also be combined, so that overall KPIs of multiple interacting processes can be tracked. Great Q&A at the end where they addressed a number of audience questions on the mechanics of using multi-event logs, and they confirmed that this will be available in the free Celonis Snap offering.
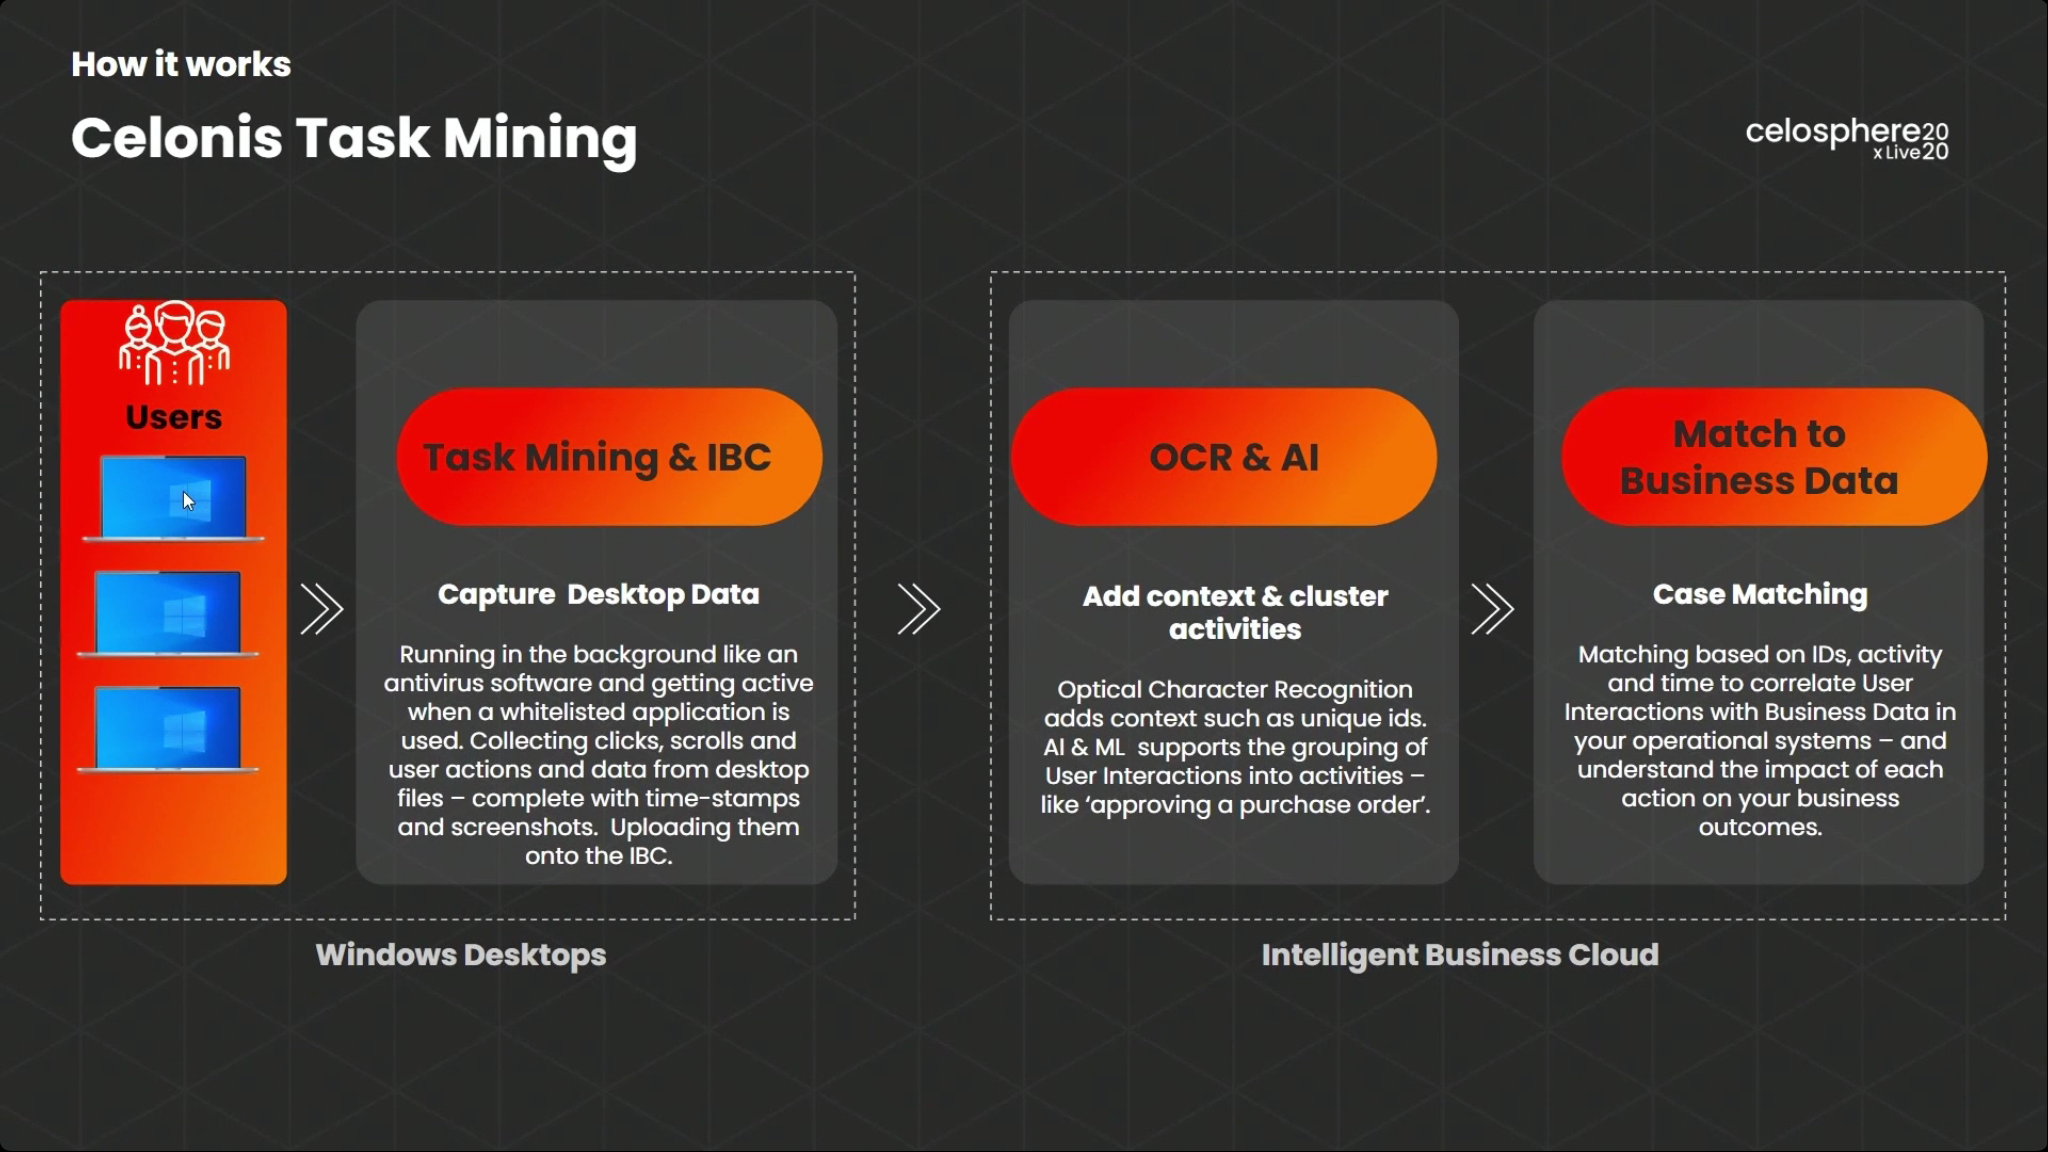
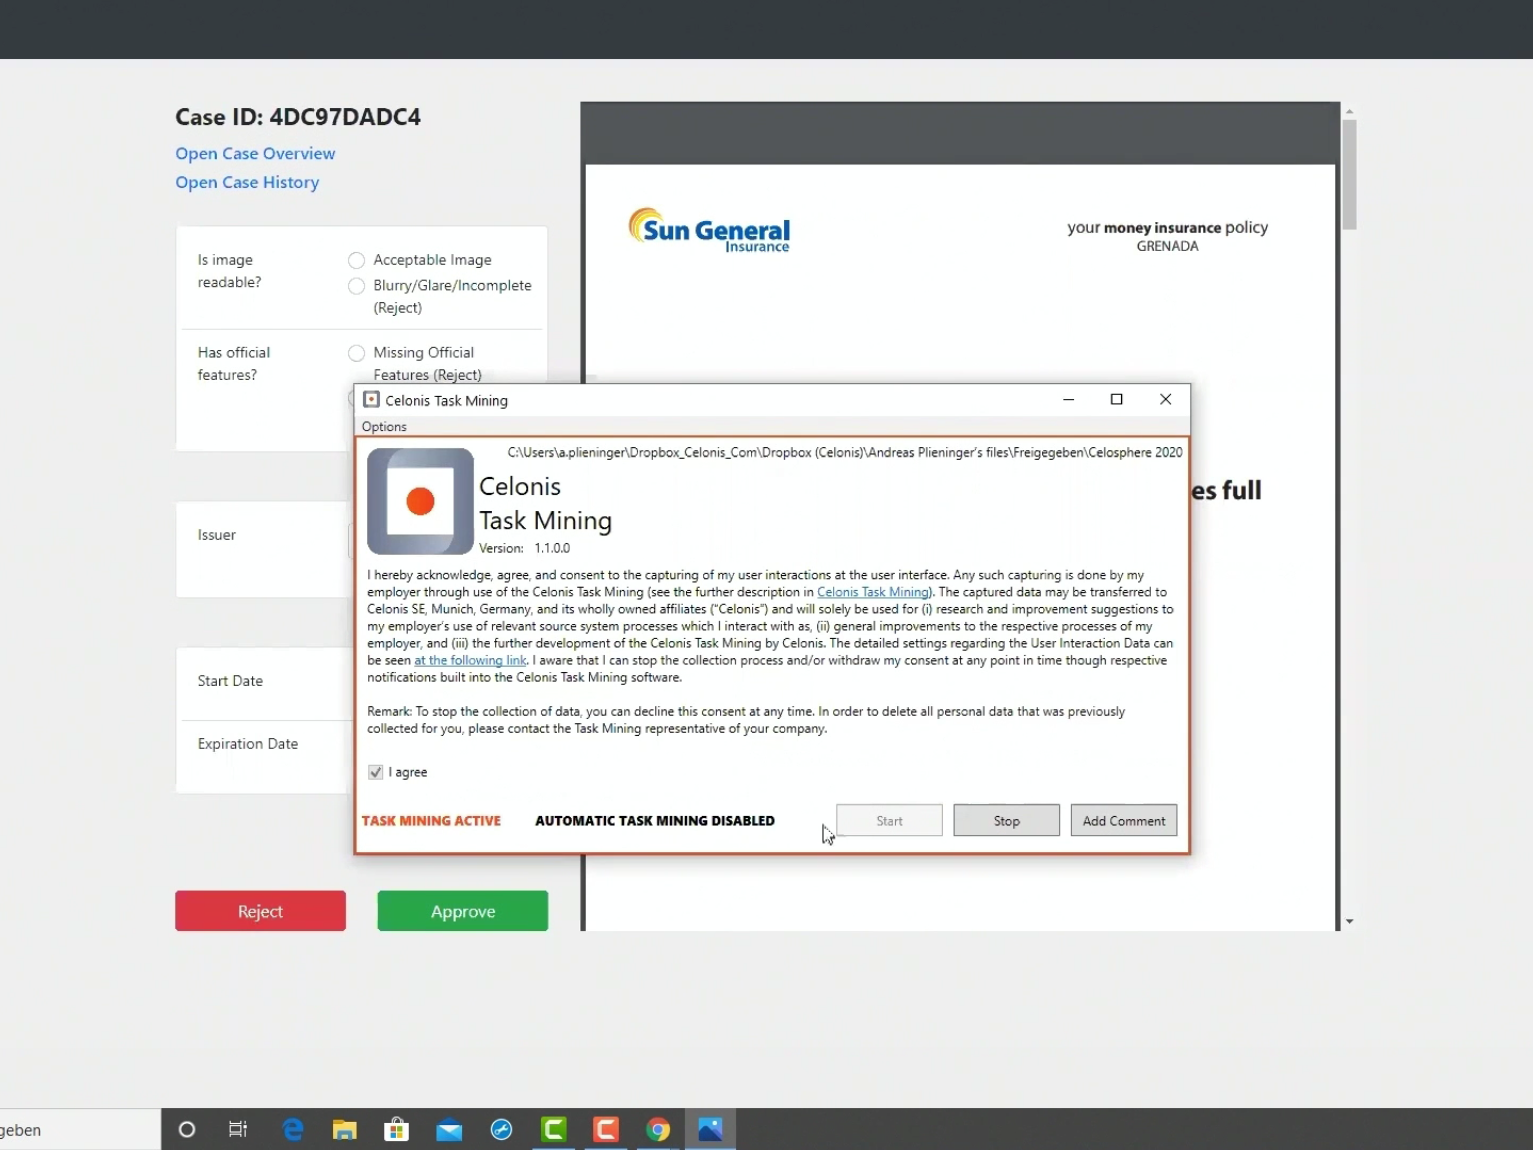
Another analysis capability not traditionally covered by process mining is task mining: what are the users doing on the desktop to interact between multiple systems? Andreas Plieninger, Product Manager, talked about how they capture user interaction data with their new Celonis Task Mining. I’ve been seeing user interaction capture being done by a few different vendors, both process mining/analysis and RPA vendors, and this really is the missing link in understanding processes: lack of this type of data capture is the reason that I spend a lot of time job-shadowing when I’m looking at an enterprise customer’s processes.
Task Mining is installed on the user’s desktop (Windows only for now), and when certain white-listed applications are used, the interaction information is captured as well as data from the desktop files, such as Excel spreadsheets. AI/ML helps to group the activities together and match them to other system processes, providing context for analysis. “Spyware” that tracks user actions on the desktop is not uncommon in productivity monitoring, but Celonis Task Mining this is a much more secure and restricted version of that, capturing just the data required for analyzing processes, and respecting the privacy of both the user and data on their screen.
Once the user interaction data is captured, it can be analyzed in the same way as process event log: it can discover the process and its variants, and trigger alerts if process compliance rules are violated. It’s in the same data later as process mining data, so can analyzed and exposed using the same AI, boards and apps structure as process data. Task Miner also captures screen snapshots to show what was actually happening as the user clicked around and entered data, and can be used to check what the user was seeing while they were working. This can be used to determine root causes for the longer-running variants, find opportunities for task automation, and check compliance.
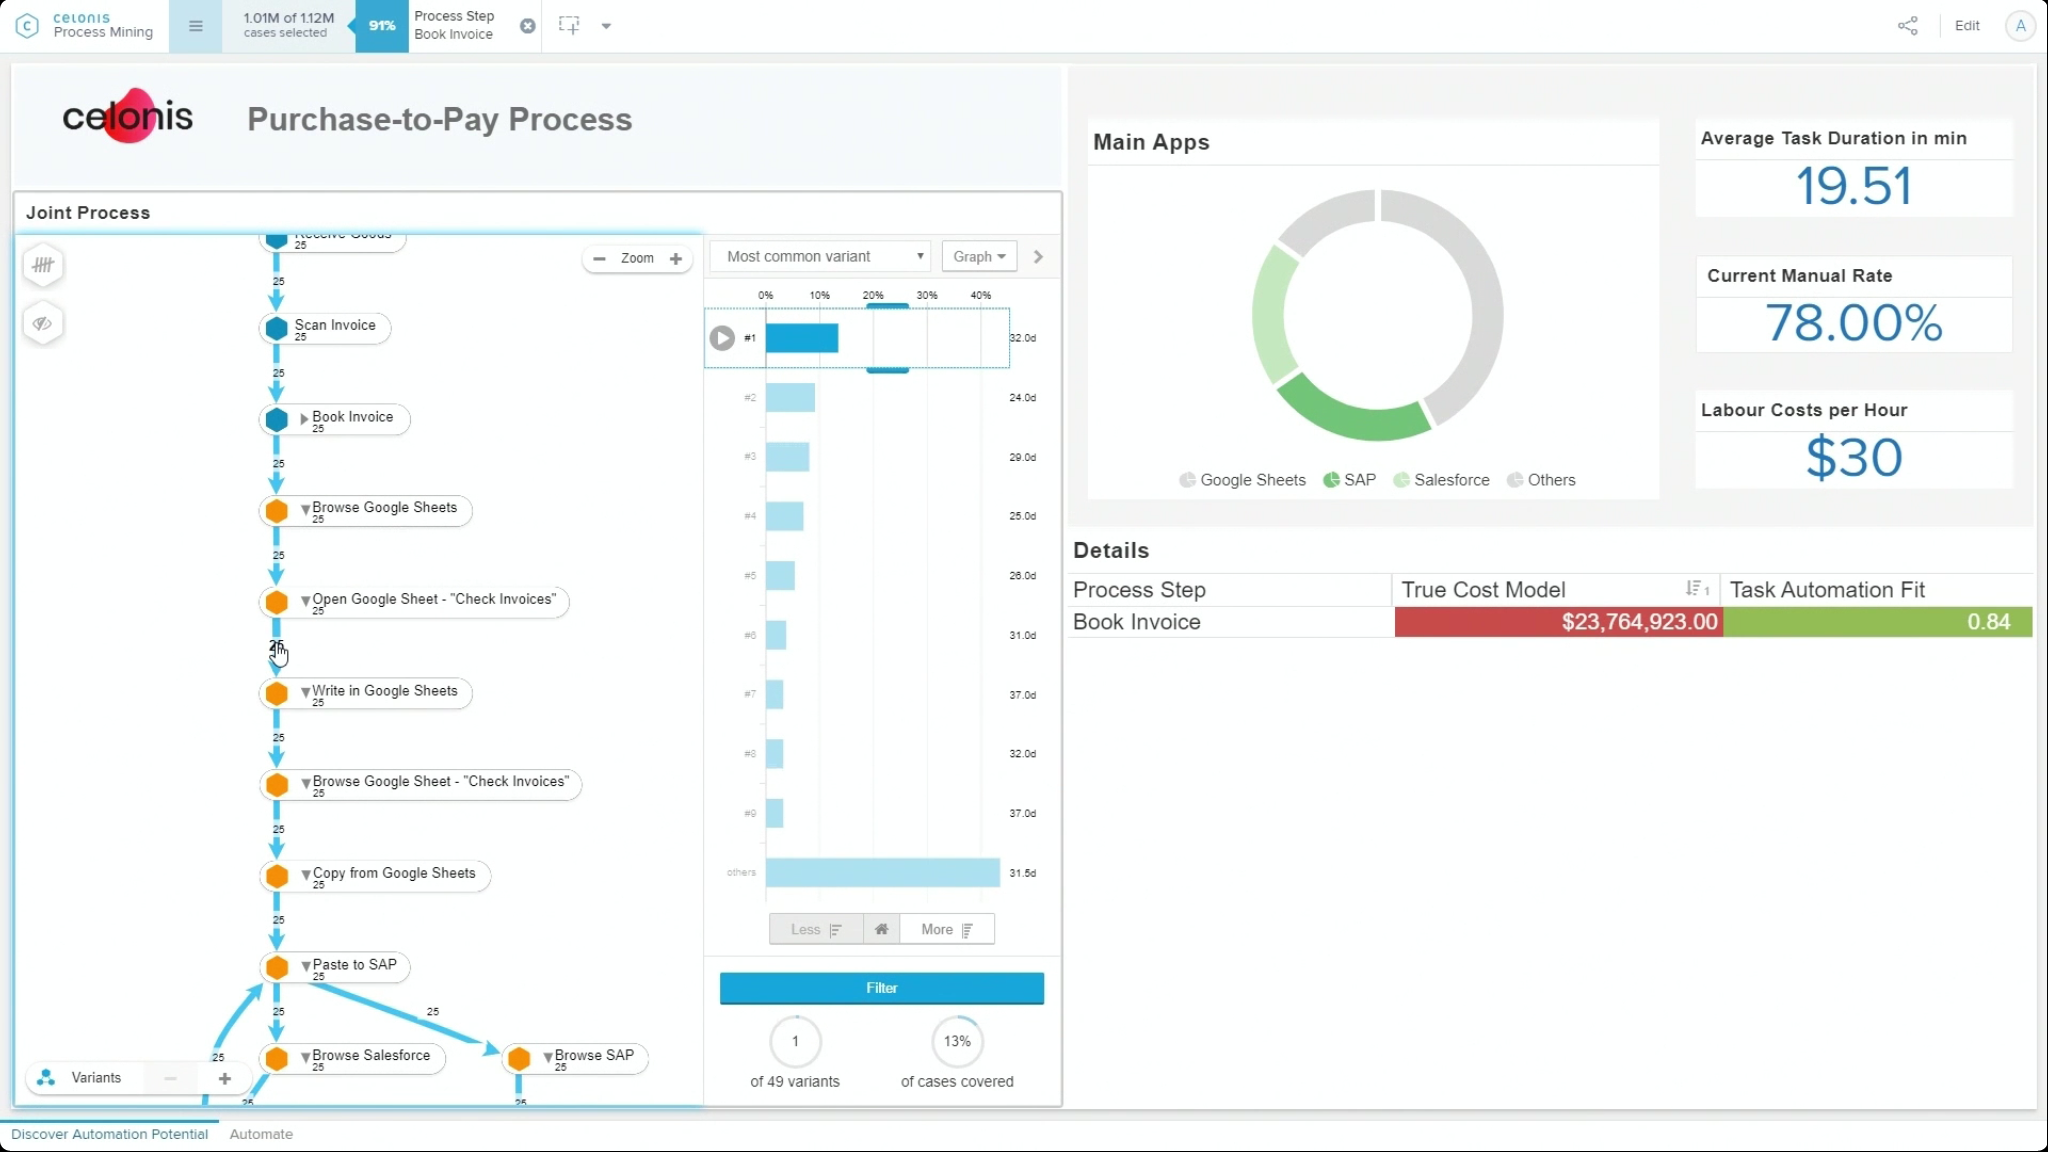
He showed a use case for finding automation opportunities in a procure-to-pay process, similar to the concept of multi-event logs where one of those logs is the user interaction data. The user interaction data is treated a bit differently, however, since it represents manual activities where you may want to apply automation. A Celonis automation could then be used to address some of the problem areas identified by the task mining, where some of the cases are completely automated, while others require human intervention. This ability to triage cases, sending only those that really need human input for someone to process, while automatically pushing actions back to the core systems to complete the others automatically, can result in significant cost savings and shortened cycle time.
Celonis Task Mining is still in an early adopter program, but is expected to be in beta by August 2020 and generally available in November. I’m predicting a big uptake in this capability, since remote work is removing the ability to use techniques such as job shadowing to understand what steps workers are taking to complete tasks. Adding Task Mining data to Process Mining data creates the complete picture of how work is actually getting done.
That’s it for me at CelosphereLive 2020; you can see replays of the presentation videos on the conference site, with the last of them likely to be published by tomorrow. Good work by Celonis on a marathon event: this ran for several hours per day over three days, although the individual presentations were pre-recorded then followed by live Q&A. Lots of logistics and good production quality, but it could have had better audience engagement through a more interactive platform such as Slack.
I’m back for the Celonis online conference, CelosphereLive, for a second day. They started much earlier since they using a European time zone, but I started in time to catch the Q&A portion of Ritu Nibber’s presentation (VP of Global Process and Controls at Reckitt Benckiser) and may go back to watch the rest of it since there were a lot of interesting questions that came up.
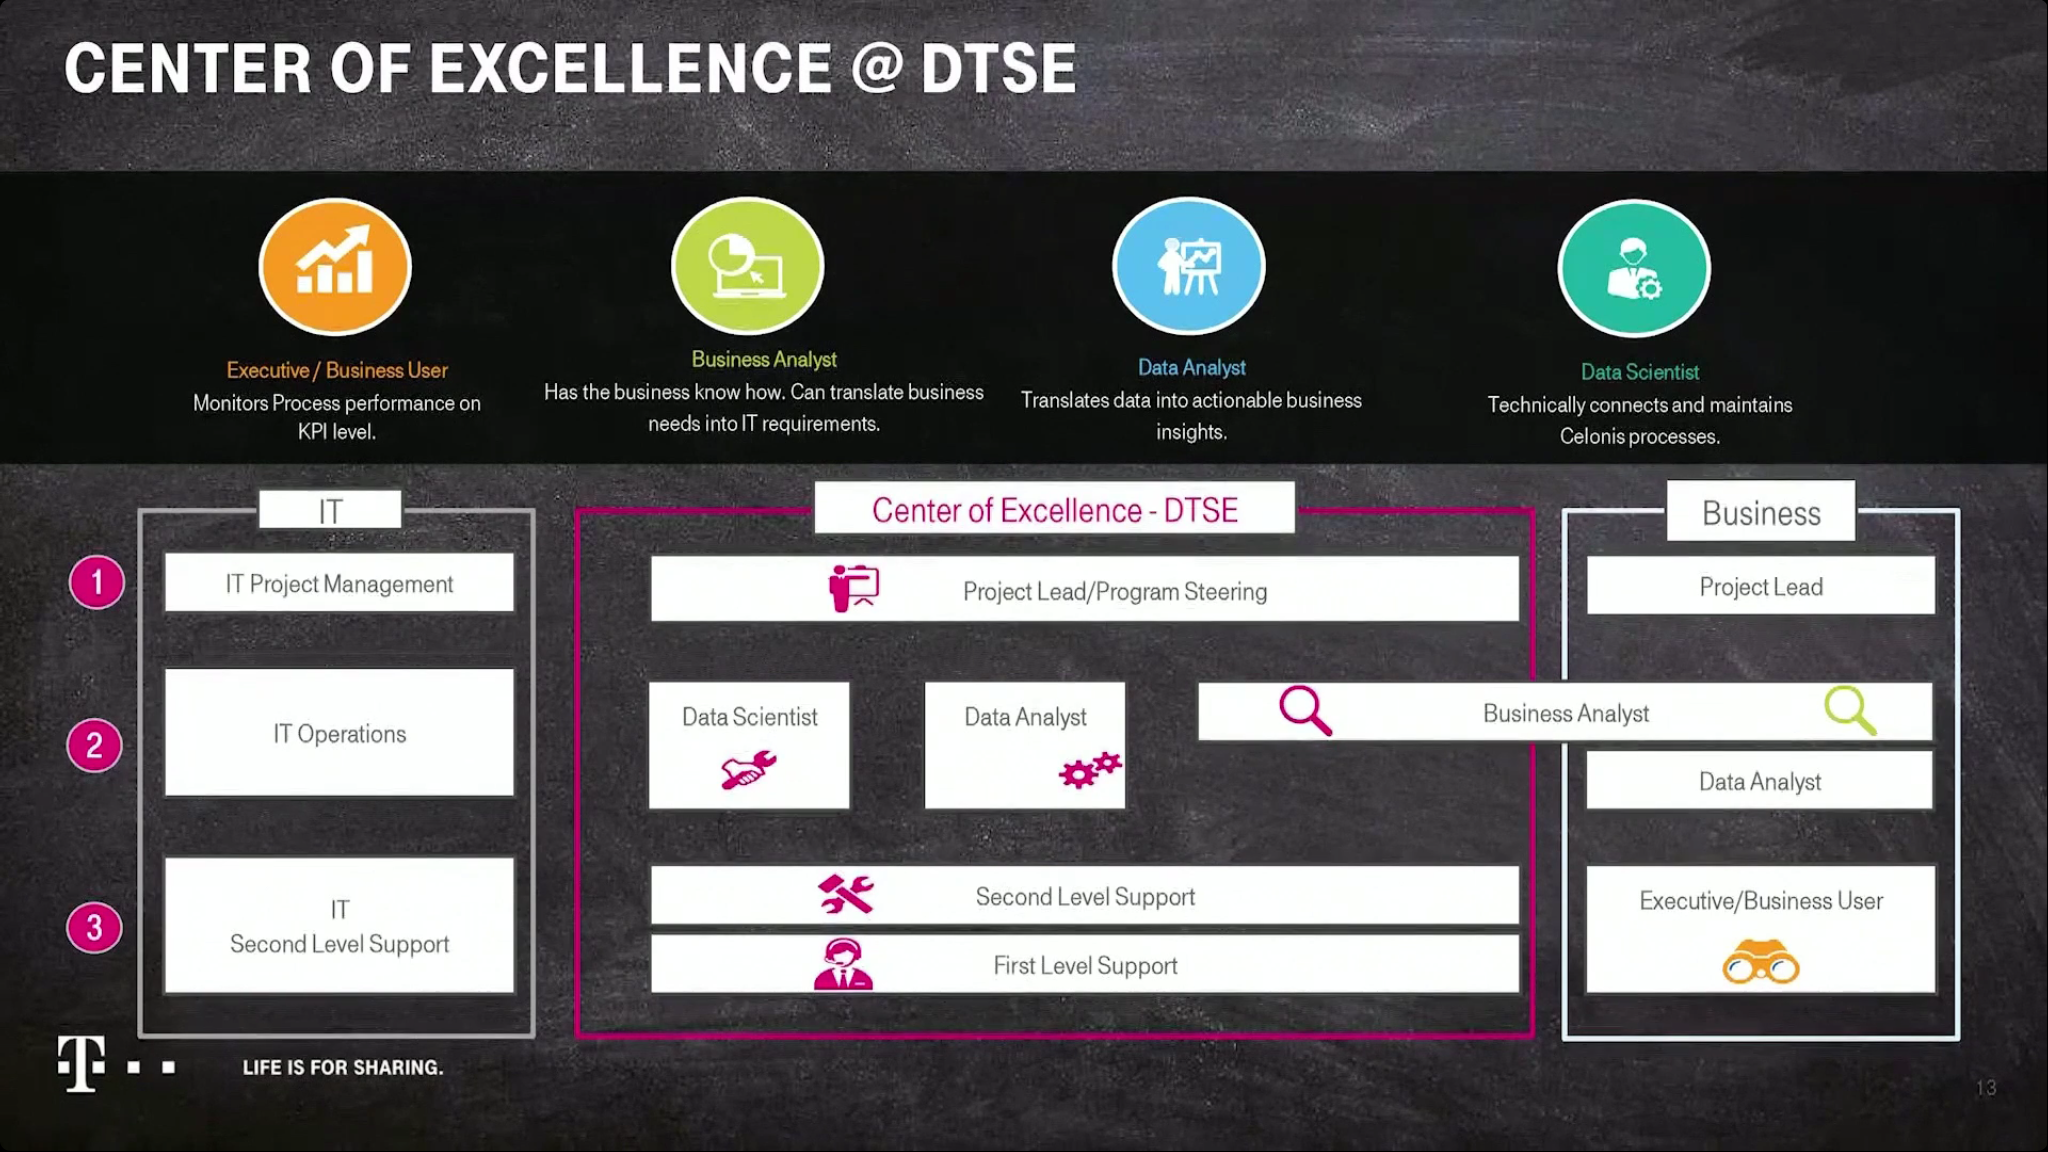
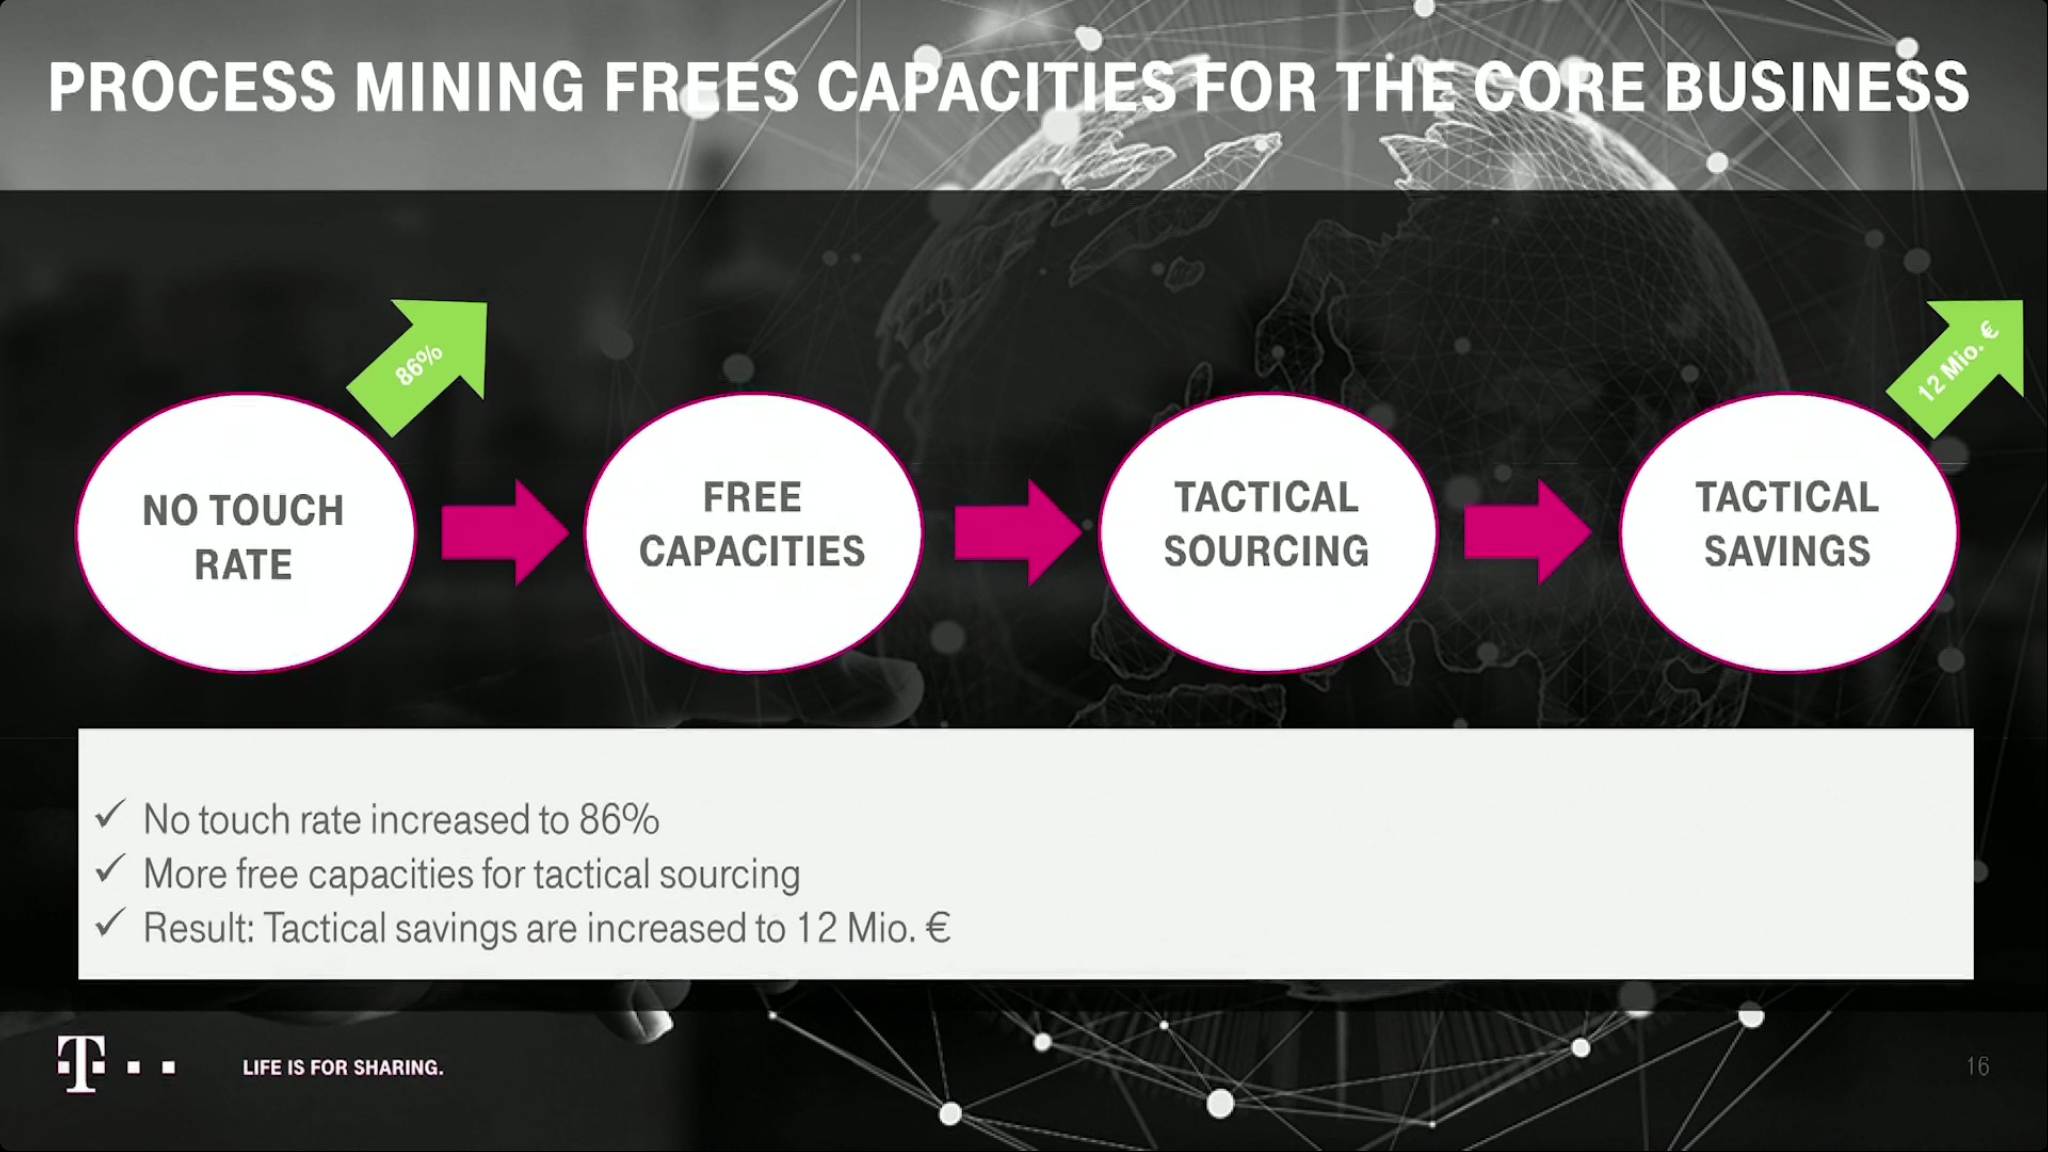
There was a 15-minute session back in their studio with Celonis co-CEO Bastian Nominacher and VP of Professional Services Sebastian Walter, then on to a presentation by Peter Tasev, SVP of Procure to Pay at Deutsche Telekom Services Europe. DTSE is a shared services organization providing process and service automation across many of their regional organizations, and they are now using Celonis to provide three key capabilities to their “process bionics”:
Monitor the end-to-end operation and efficiency of their large, heterogeneous processes such as procure-to-pay. They went through the process of identifying the end-to-end KPIs to include into an operational monitoring view, then use the dashboard and reports to support data-driven decisions.
Use of process mining to “x-ray” their actual processes, allowing for process discovery, conformance checking and process enhancement.
Track real-time breaches of rules in the process, and alert the appropriate people or trigger automated activities.
Interesting to see their architecture and roadmap, but also how they have structured their center of excellence with business analysts being the key “translator” between business needs and the data analysts/scientists, crossing the boundary between the business areas and the CoE.
He went through their financial savings, which were significant, and also mentioned the ability of process mining to identify activities that were not necessary or could be automated, thereby freeing up the workforce to do more value-added activities such as negotiating prices. Definitely worth watch the replay of this presentation to understand the journey from process mining to real-time operational monitoring and alerting.
It’s clear that Celonis is repositioning from just process mining — a tool for a small number of business analysts in an organization — into operational process intelligence that would be a daily dashboard tool for a much large portion of the workforce. Many other process mining products are attempting an equivalent pivot, although Celonis seems to be a bit farther along than most.
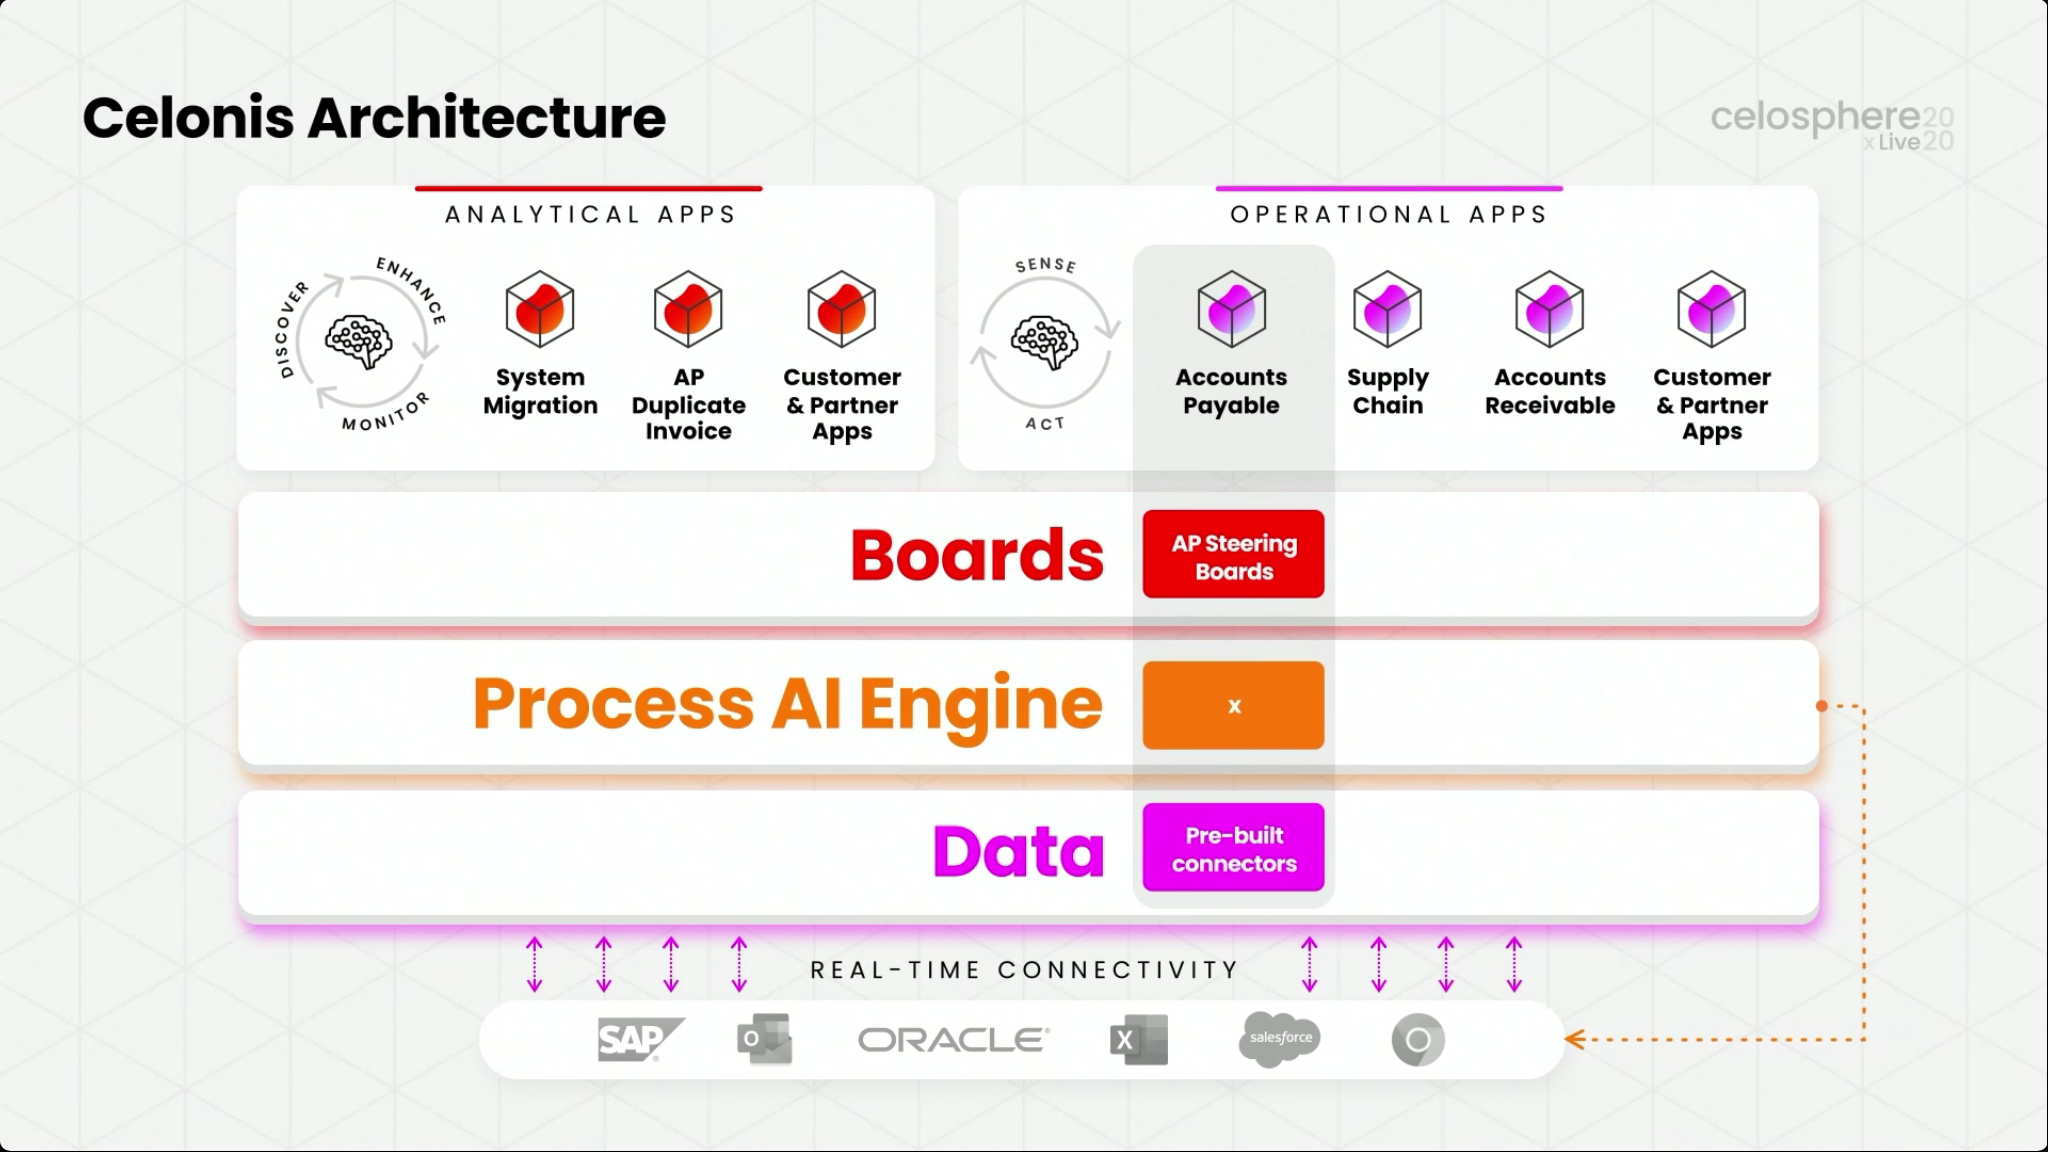
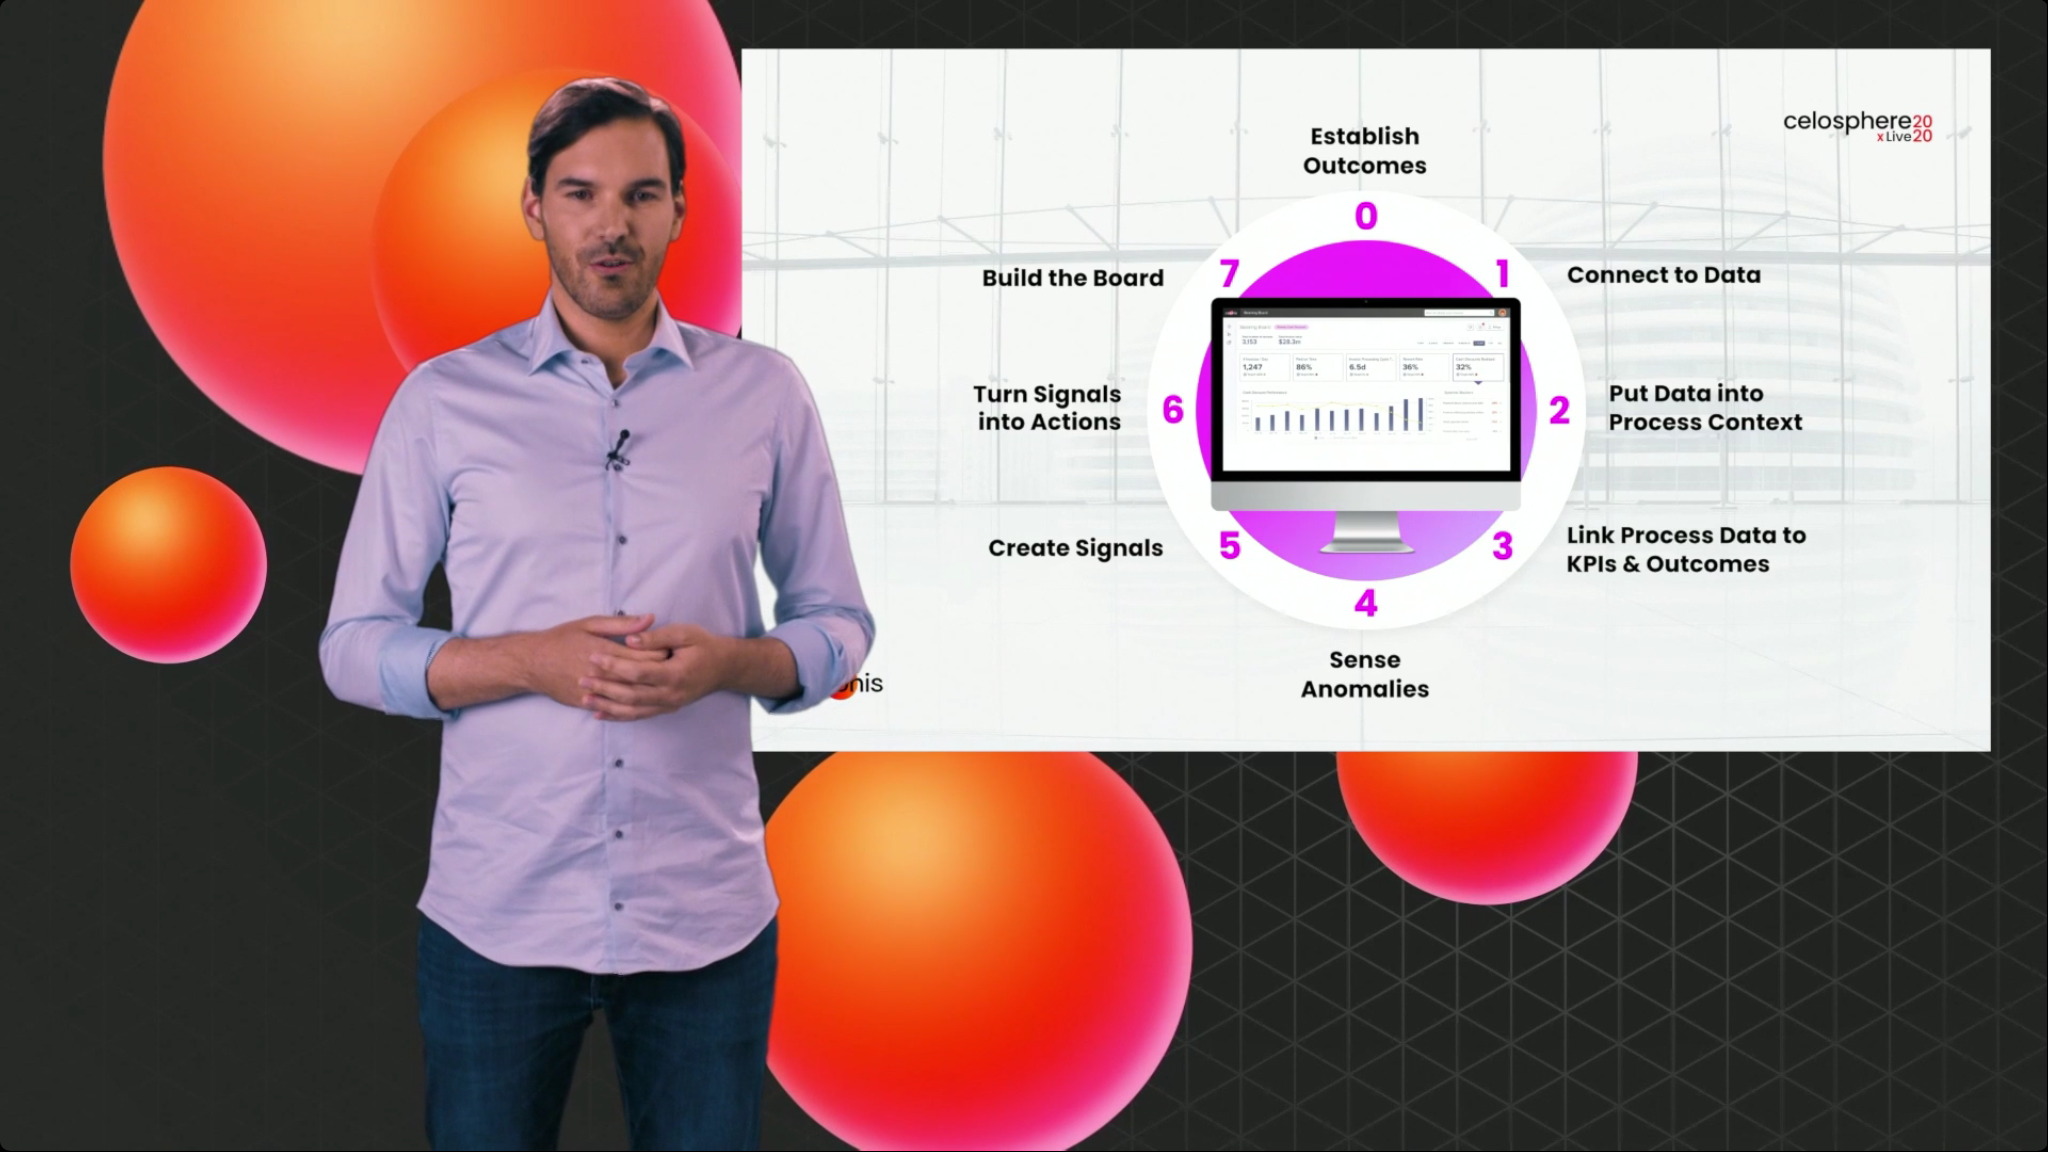
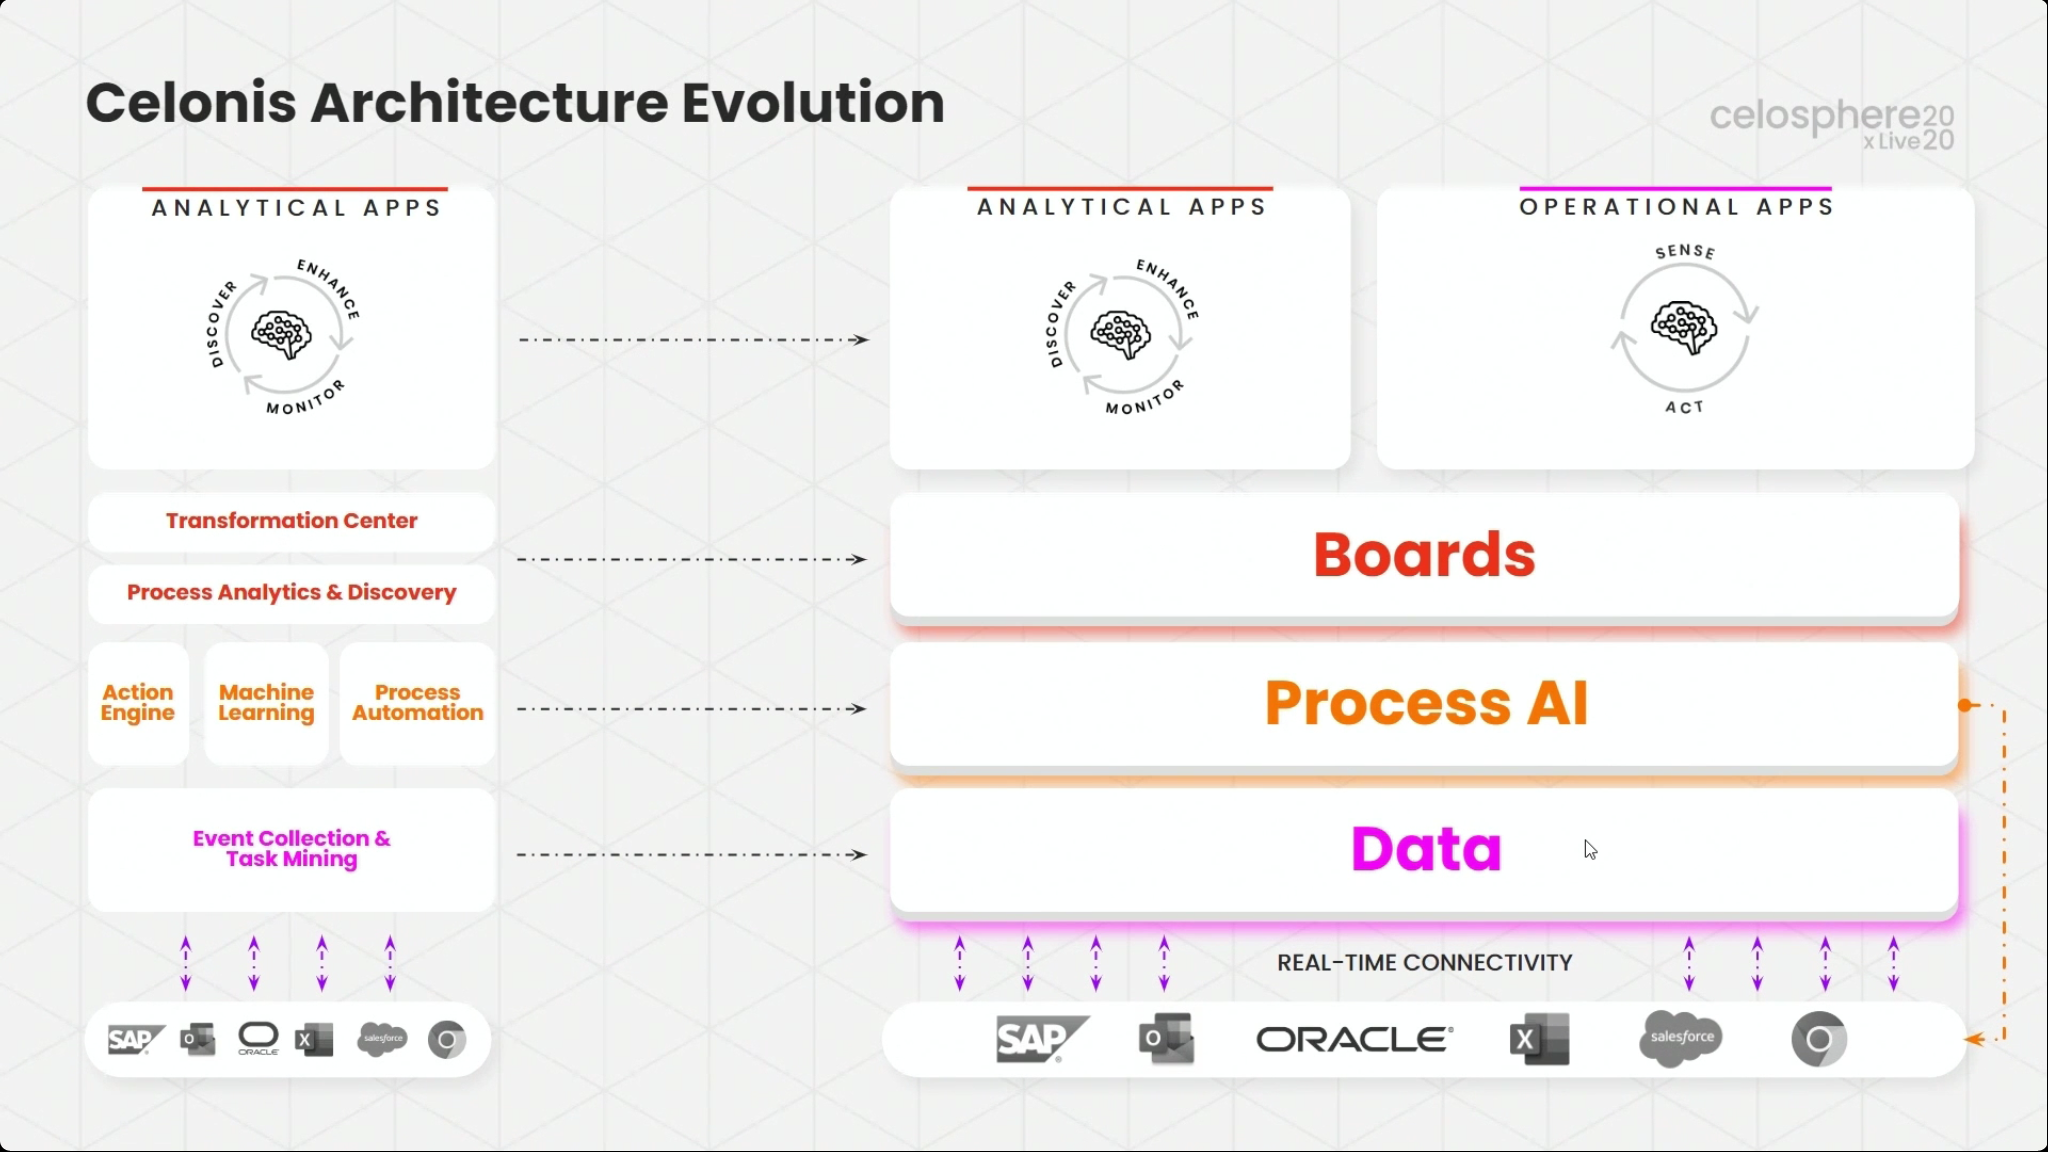
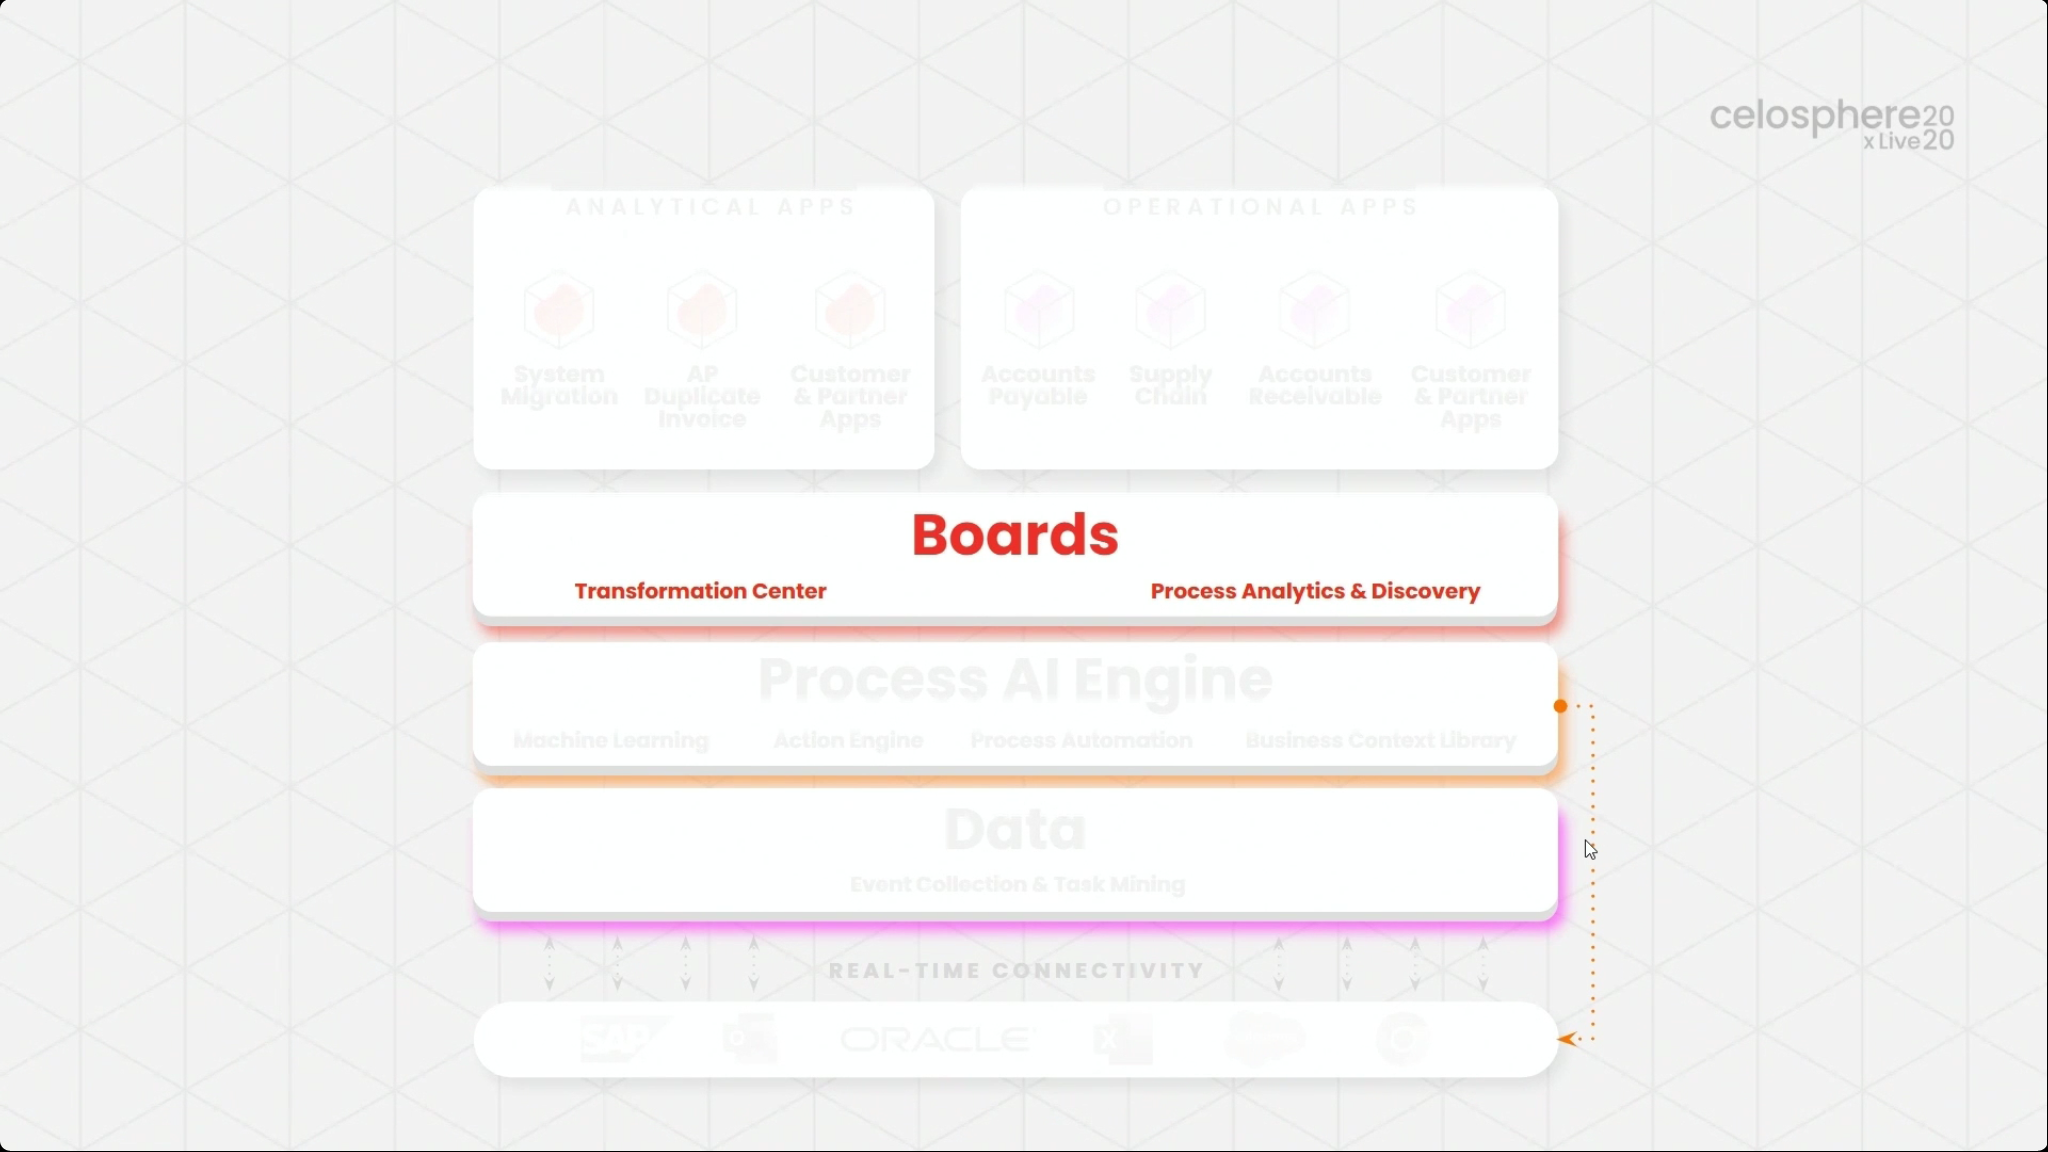
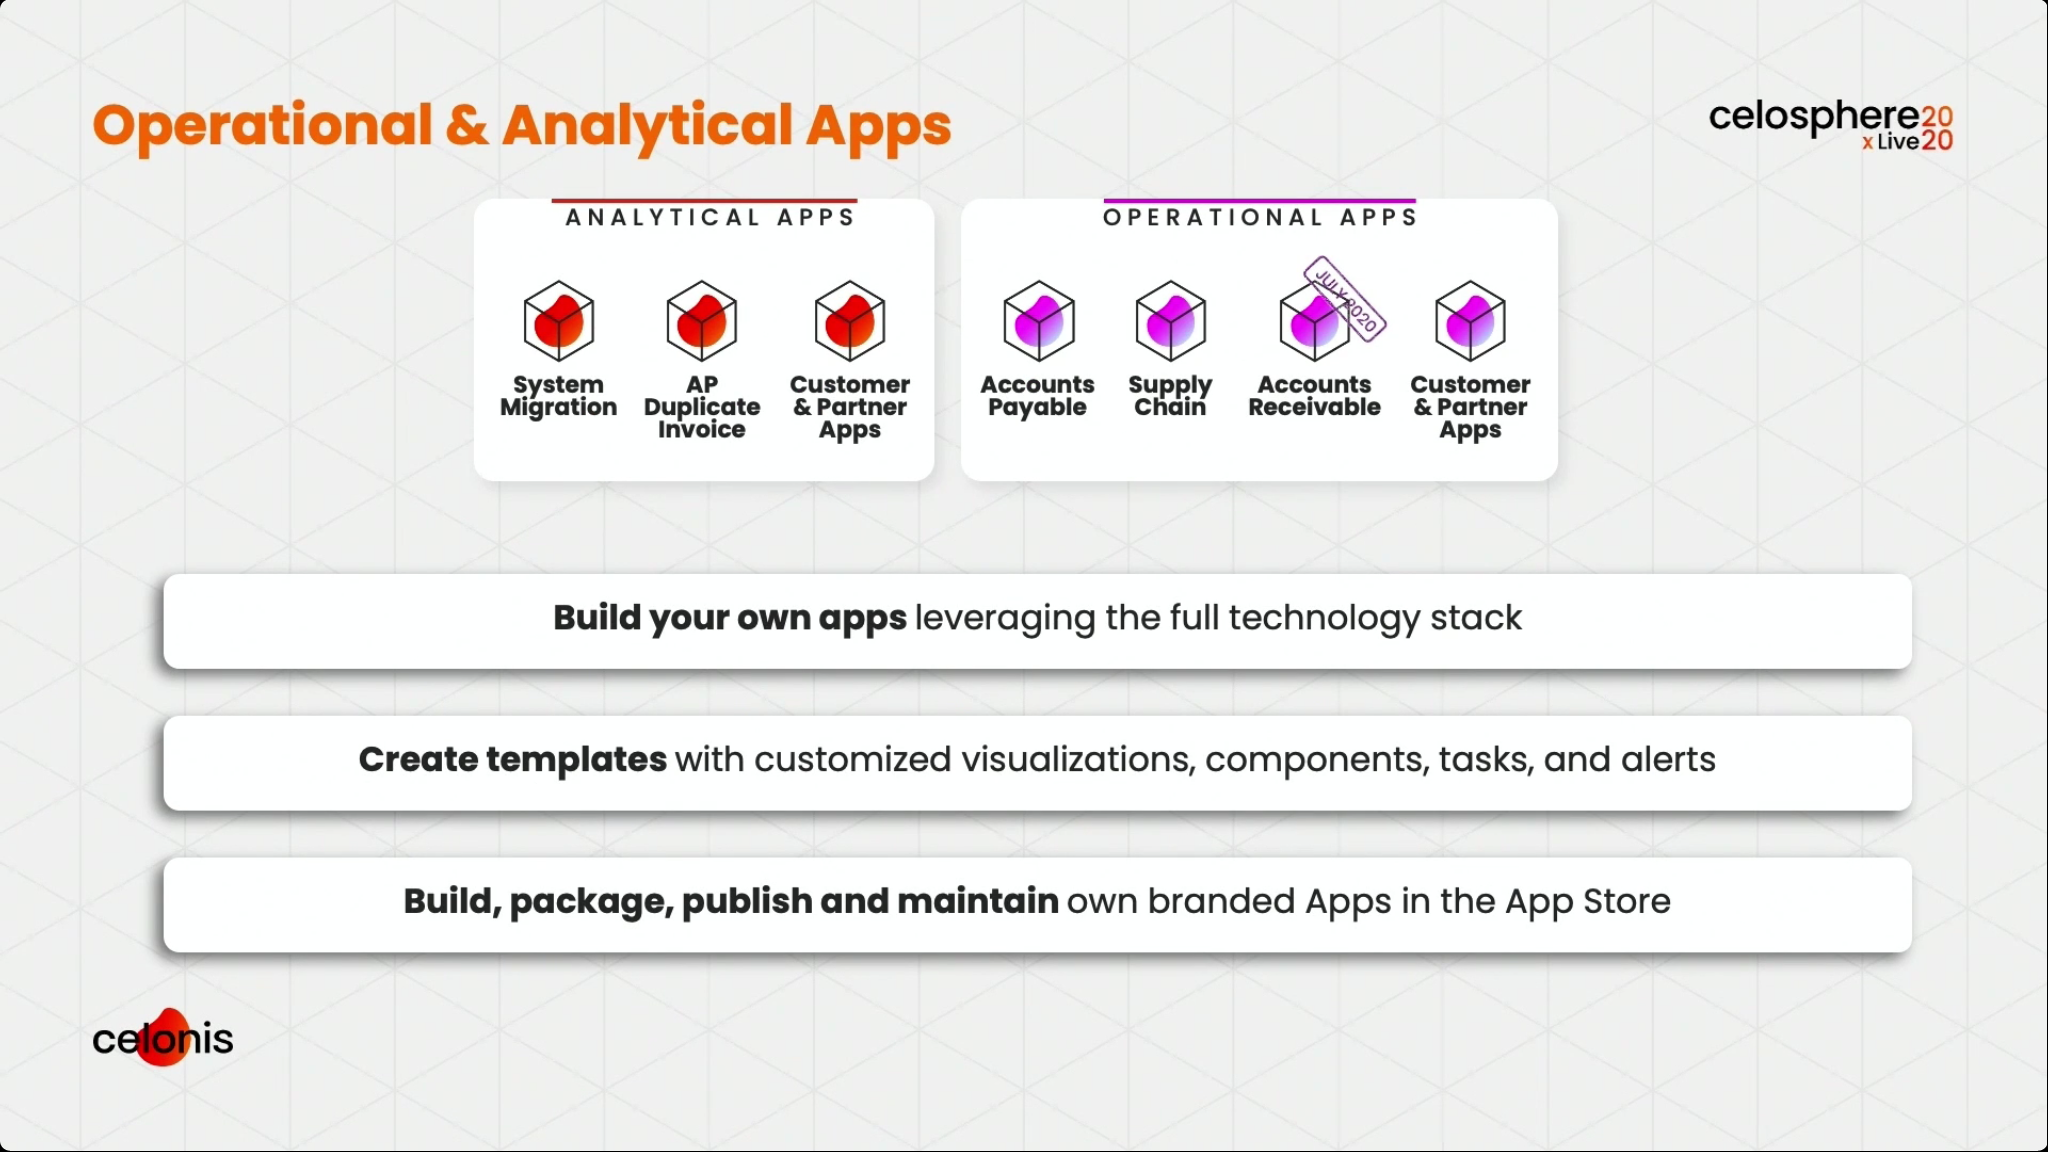
Martin Klenk, Celonis CTO, gave an update on their technology strategy, with an initial focus on how the Celonis architecture enables the creation of these real-time operational apps: real-time connectors feed into a data layer, which is analyzed by the Process AI Engine, and then exposed through Boards that integrate data and other capabilities for visualization. Operational and analytical apps are then created based on Boards. Although Celonis has just released two initial Accounts Payable and Supply Chain operational apps, this is something that customers and partners can build in order to address their particular needs.
He showed how a custom operational app can be created for a CFO to show how this works, using a real-time connectors to Salesforce for order data and Jira for support tickets. He showed their multi-event log analytical capability, which makes it much easier to bring together data sources from different systems and automatically correlate them without a lot of manual data cleansing — the links between processes in different systems are identified without human intervention. This allows detection of anomalies that occur on boundaries between systems, rather than just within systems.
Signals can be created based on pre-defined patterns or from scratch, allowing a real-time data-driven alert to be issued when required, or an automation push to another system be triggered. This automation capability is a critical differentiator, allowing for a simple workflow based on connector steps, and can replace the need for some amount of other process automation technologies such as RPA in cases where those are not a good fit.
He was joined by Martin Rowlson, Global Head of Process Excellence at Uber; they are consolidating data from all of their operational arms (drive, eats, etc.) to analyze their end-to-end processes, and using process mining and task mining to identify areas for process improvement. They are analyzing some critical processes, such as driver onboarding and customer support, to reduce friction and improve the process for both Uber and the driver or customer.
Klenk’s next guest as Philipp Grindemann, head of Business Development at Lufthansa CityLine, discussing how they are using Celonis to optimize their core operations. They track maintenance events on their aircraft, plus all ground operations activities. Ground operations are particularly complex due to the high degree of parallelism: an aircraft may be refueled at the same time that cargo is being loaded. I have to guess that their operations are changing radically right now and they are having to re-structure their processes, although that wasn’t discussed.
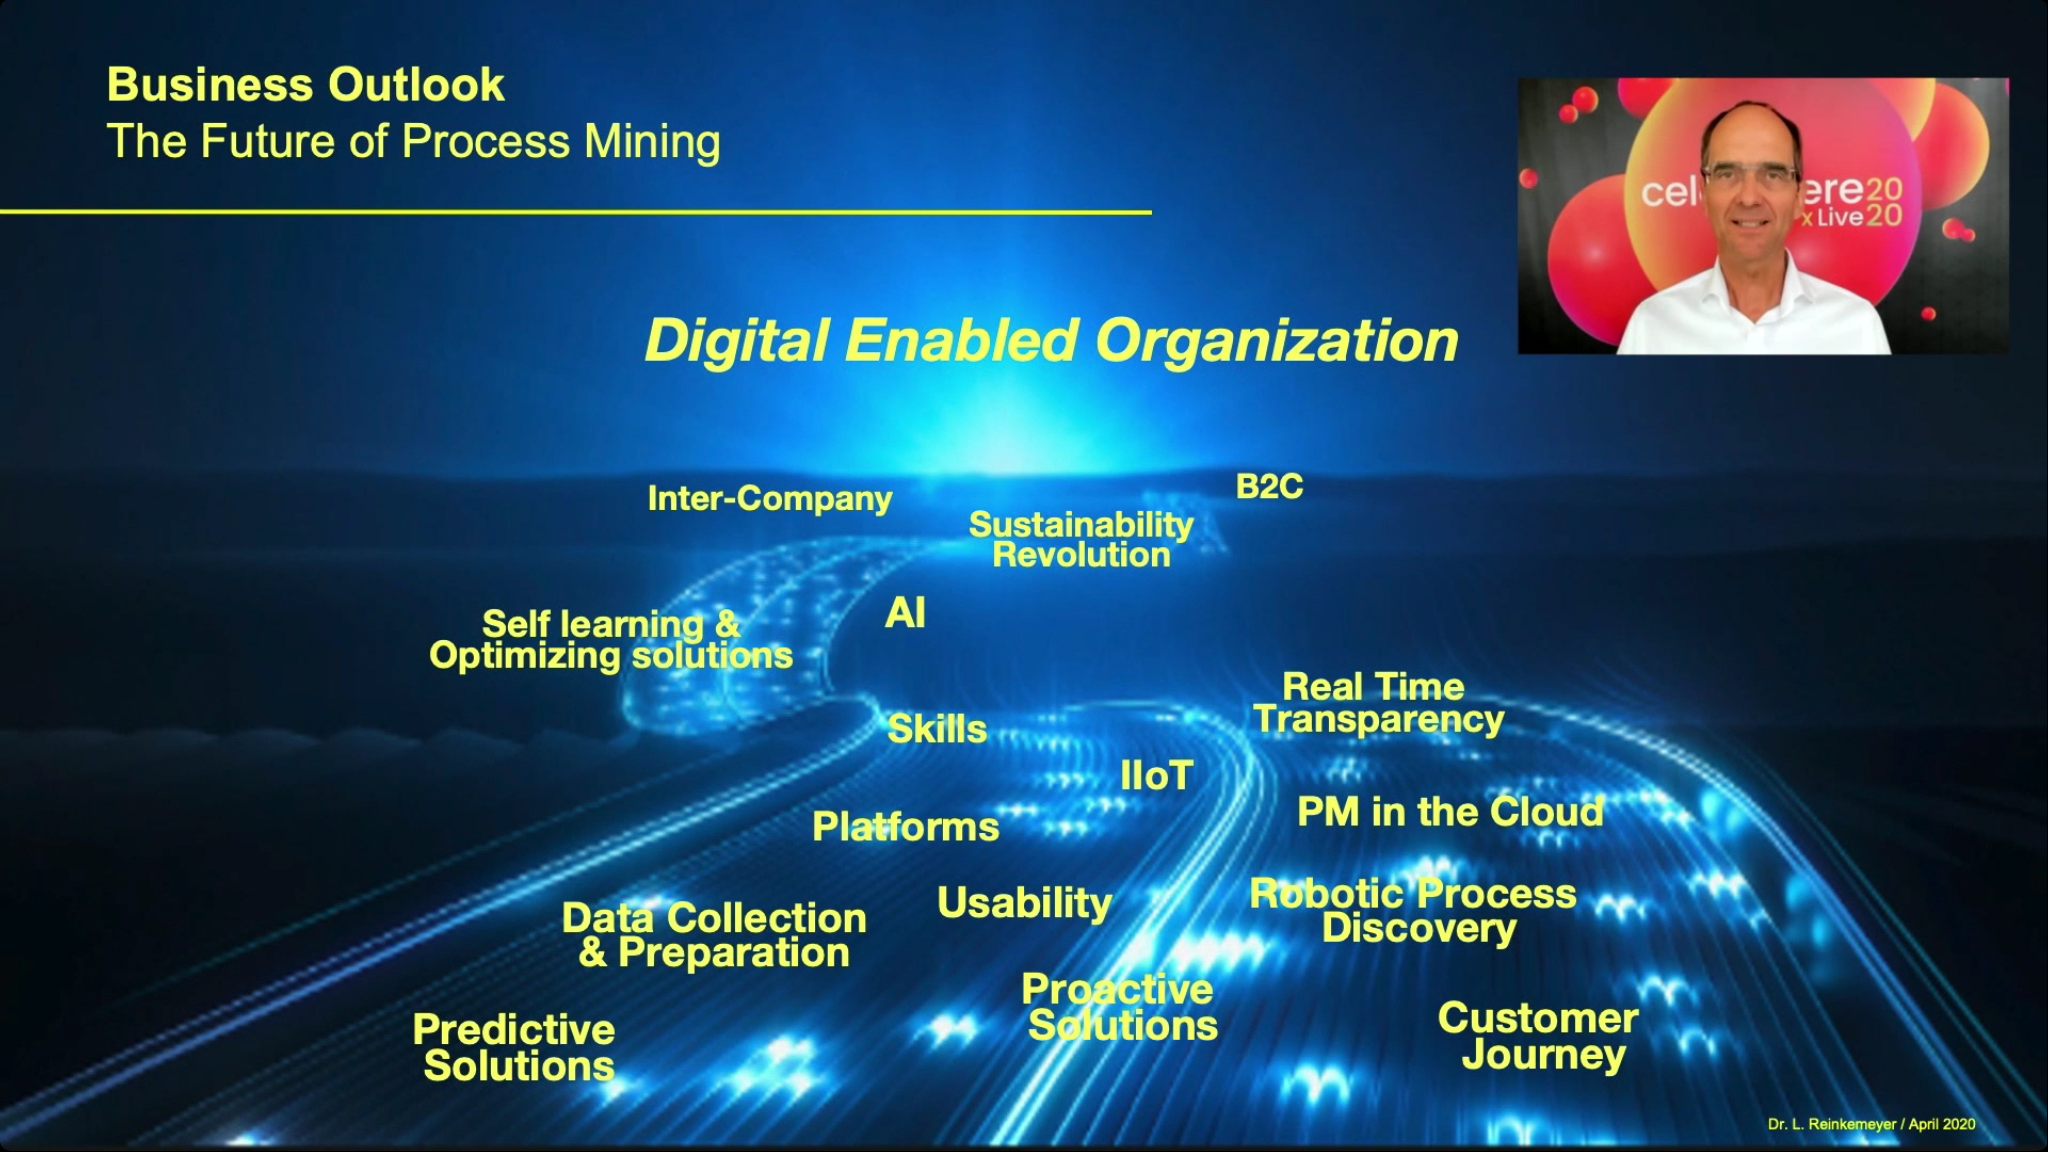
His last guest was Dr. Lars Reinkemeyer, author of Process Mining in Action — his book has collected and documented many real-world use cases for process mining — to discuss some of the expected directions of process mining beyond just analytics.
They then returned to a studio session for a bit more interactive Q&A; the previous technology roadmap keynote was pre-recorded and didn’t allow for any audience questions, although I think that the customers that he interviewed will have full presentations later in the conference.
#CelosphereLive lunch break
As we saw in at CamundaCon Live last week, there is no break time in the schedule: if you want to catch all of the presentations and discussions in real time, be prepared to carry your laptop with you everywhere during the day. The “Live from the Studio” sessions in between presentations are actually really interesting, and I don’t want to miss those. Today, I’m using their mobile app on my tablet just for the streaming video, which lets me take screenshots as well as carry it around with me, then using my computer for blogging, Twitter, screen snap editing and general research. This means that I can’t use their chat or Q&A functions since the app does not let you stream the video and use the chat at the same time, and the chat wasn’t very interesting yesterday anyway.
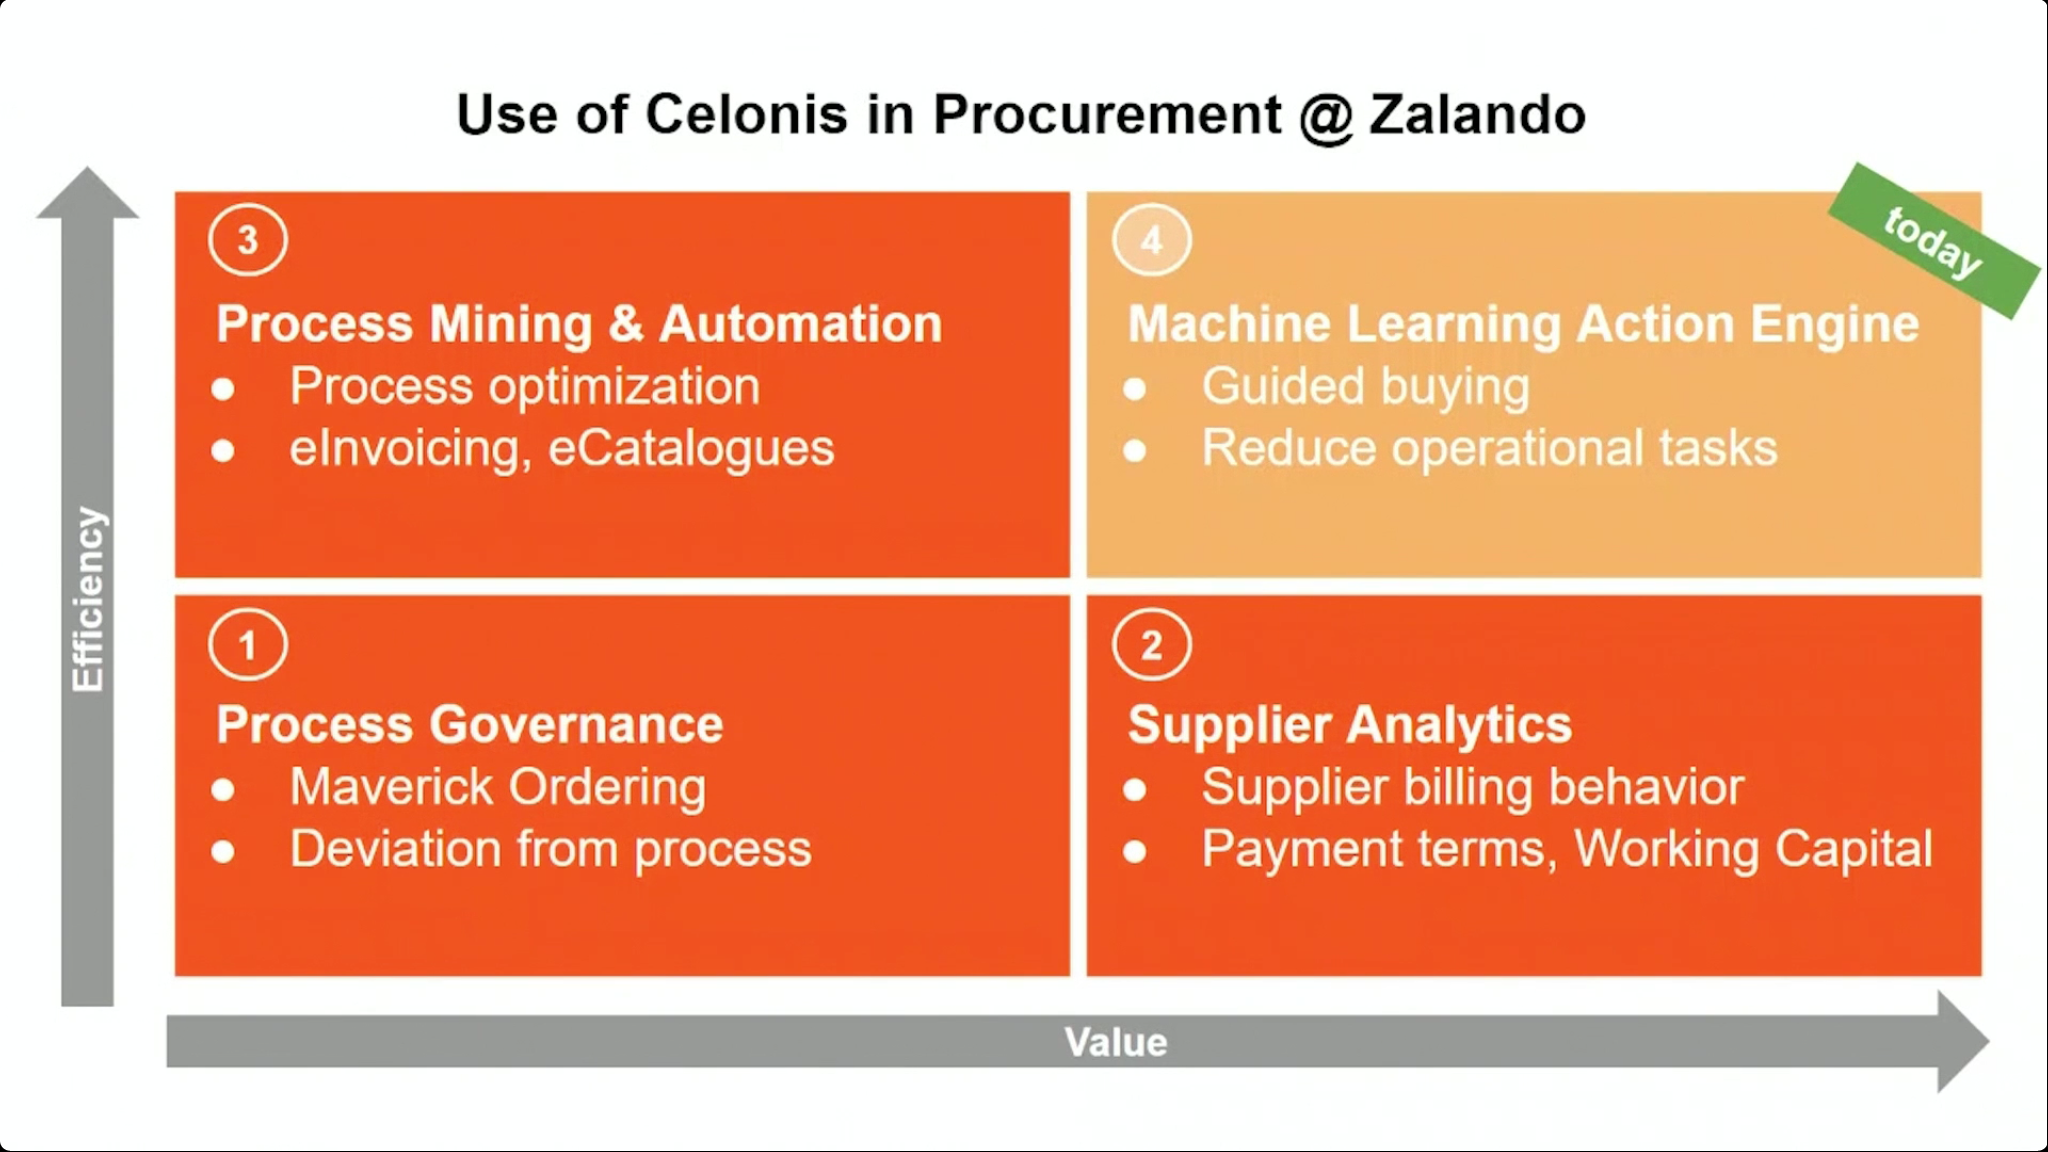
The next presentation was by Zalando, a European online fashion retailer, with Laura Henkel, their Process Mining Lead, and Alejandro Basterrechea, Head of Procurement Operations. They have moved beyond just process mining, and are using Celonis to create machine learning recommendations to optimize procurement workflows: the example that we saw provided Amazon-like recommendations for internal buyers. They also use the process automation capabilities to write information back to the source systems, showing how Celonis can be used for automating multi-system integration where you don’t already have process automation technology in place to handle this. Their key benefits in adding Celonis to their procurement processes have been efficiency, quality and value creation. Good interactive audience Q&A at the end where they discuss their journey and what they have planned next with the ML/AI capabilities. It worked well with two co-presenters, since one could be identifying a question for their area while the other was responding to a different question, leaving few gaps in the conversation.
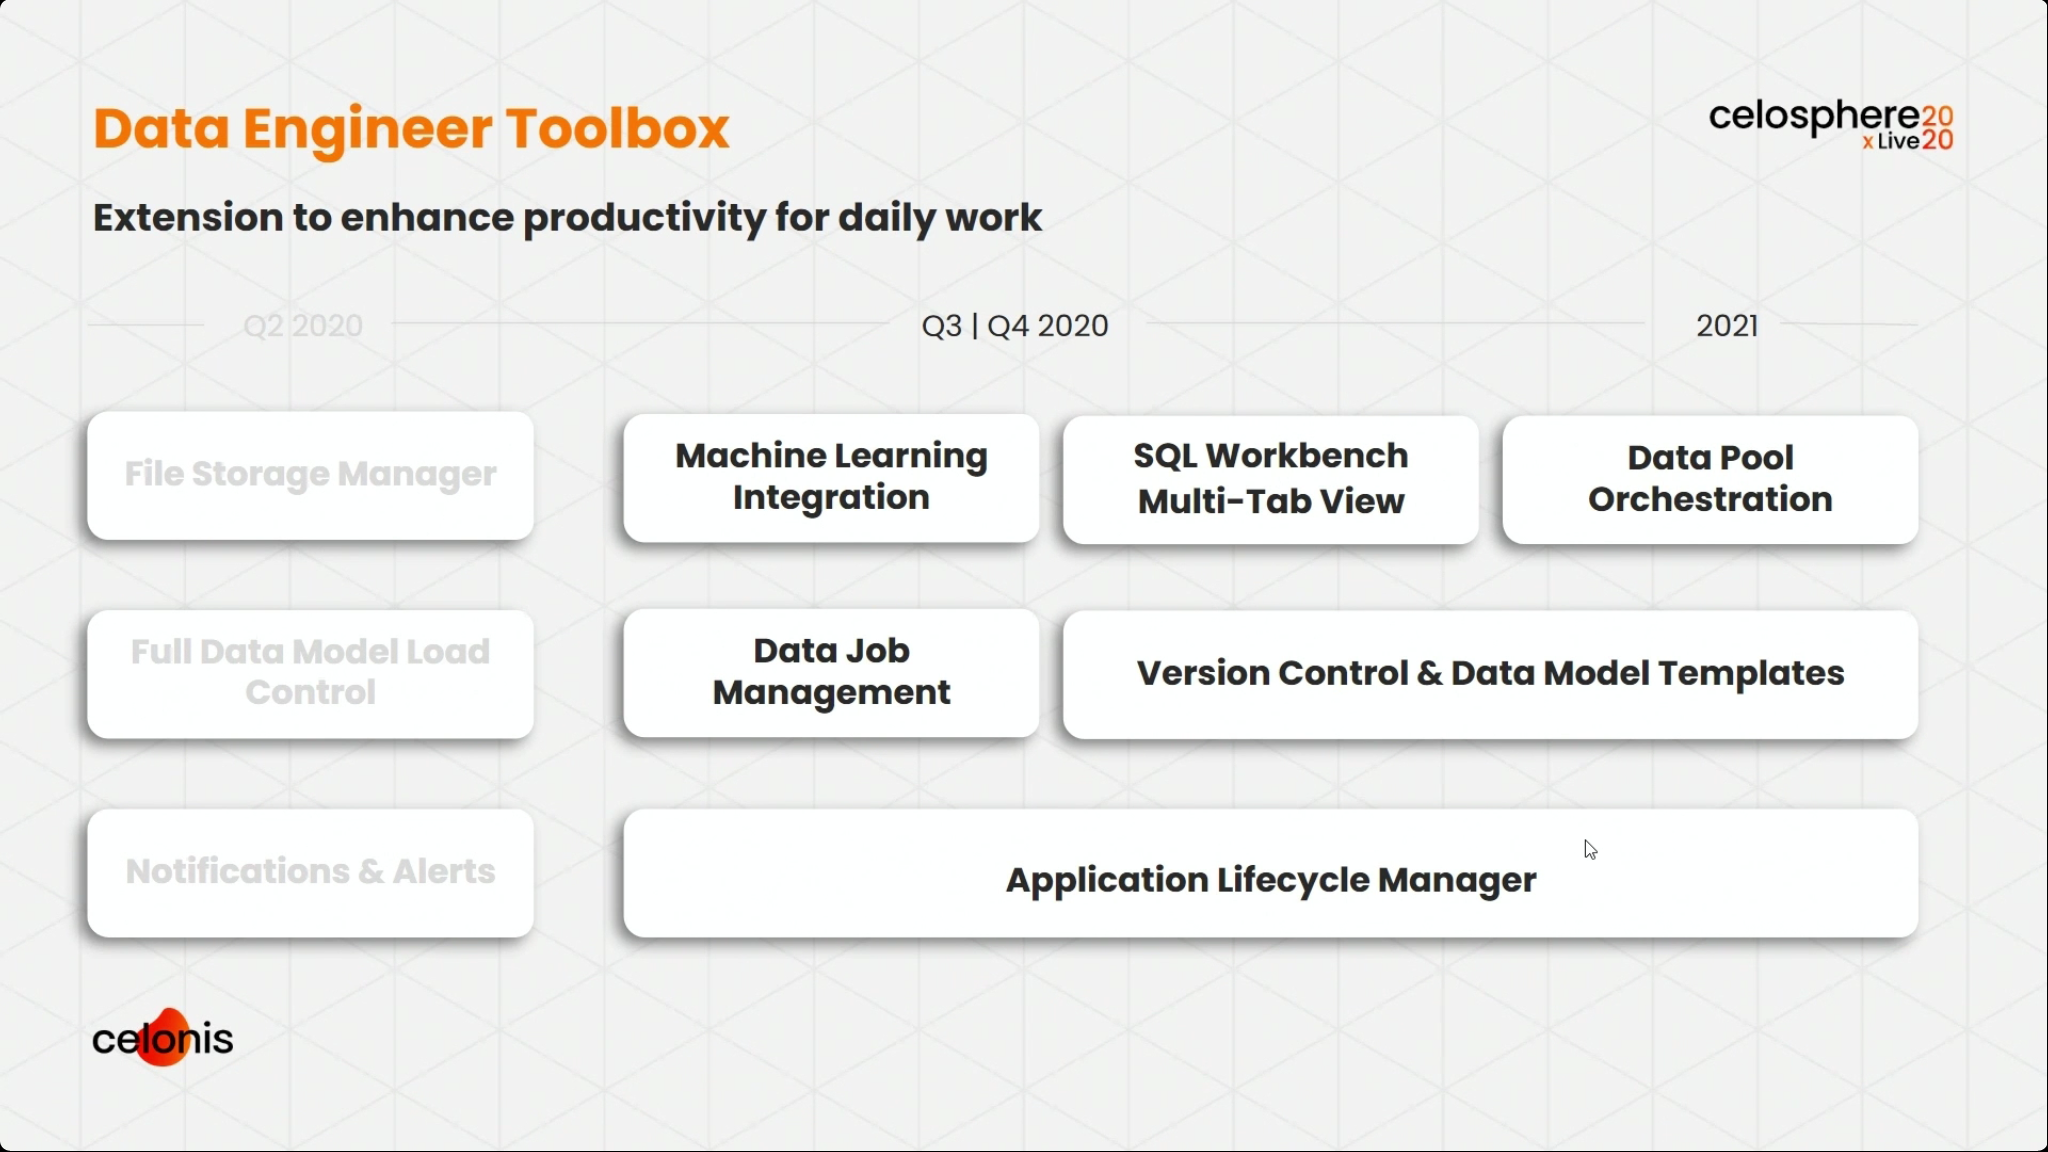
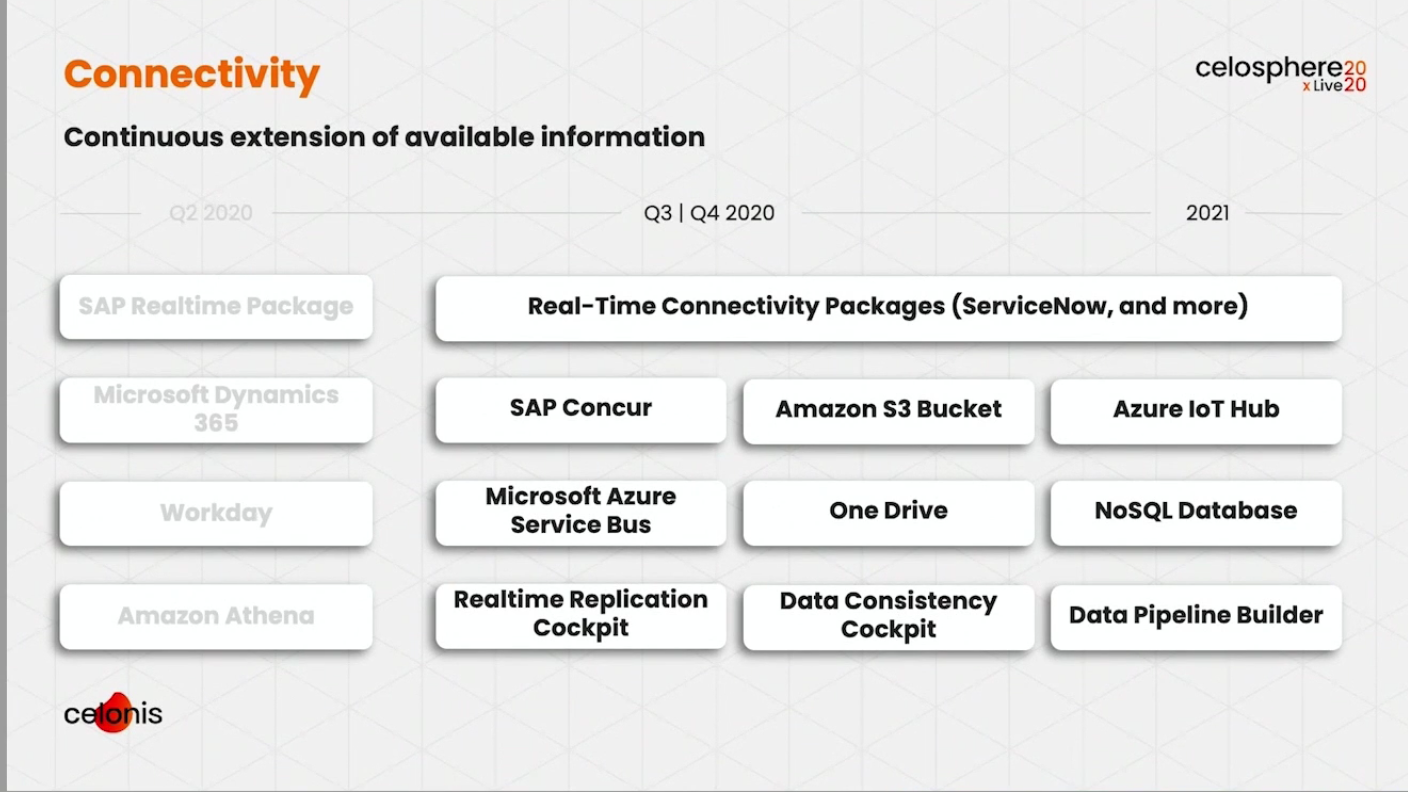
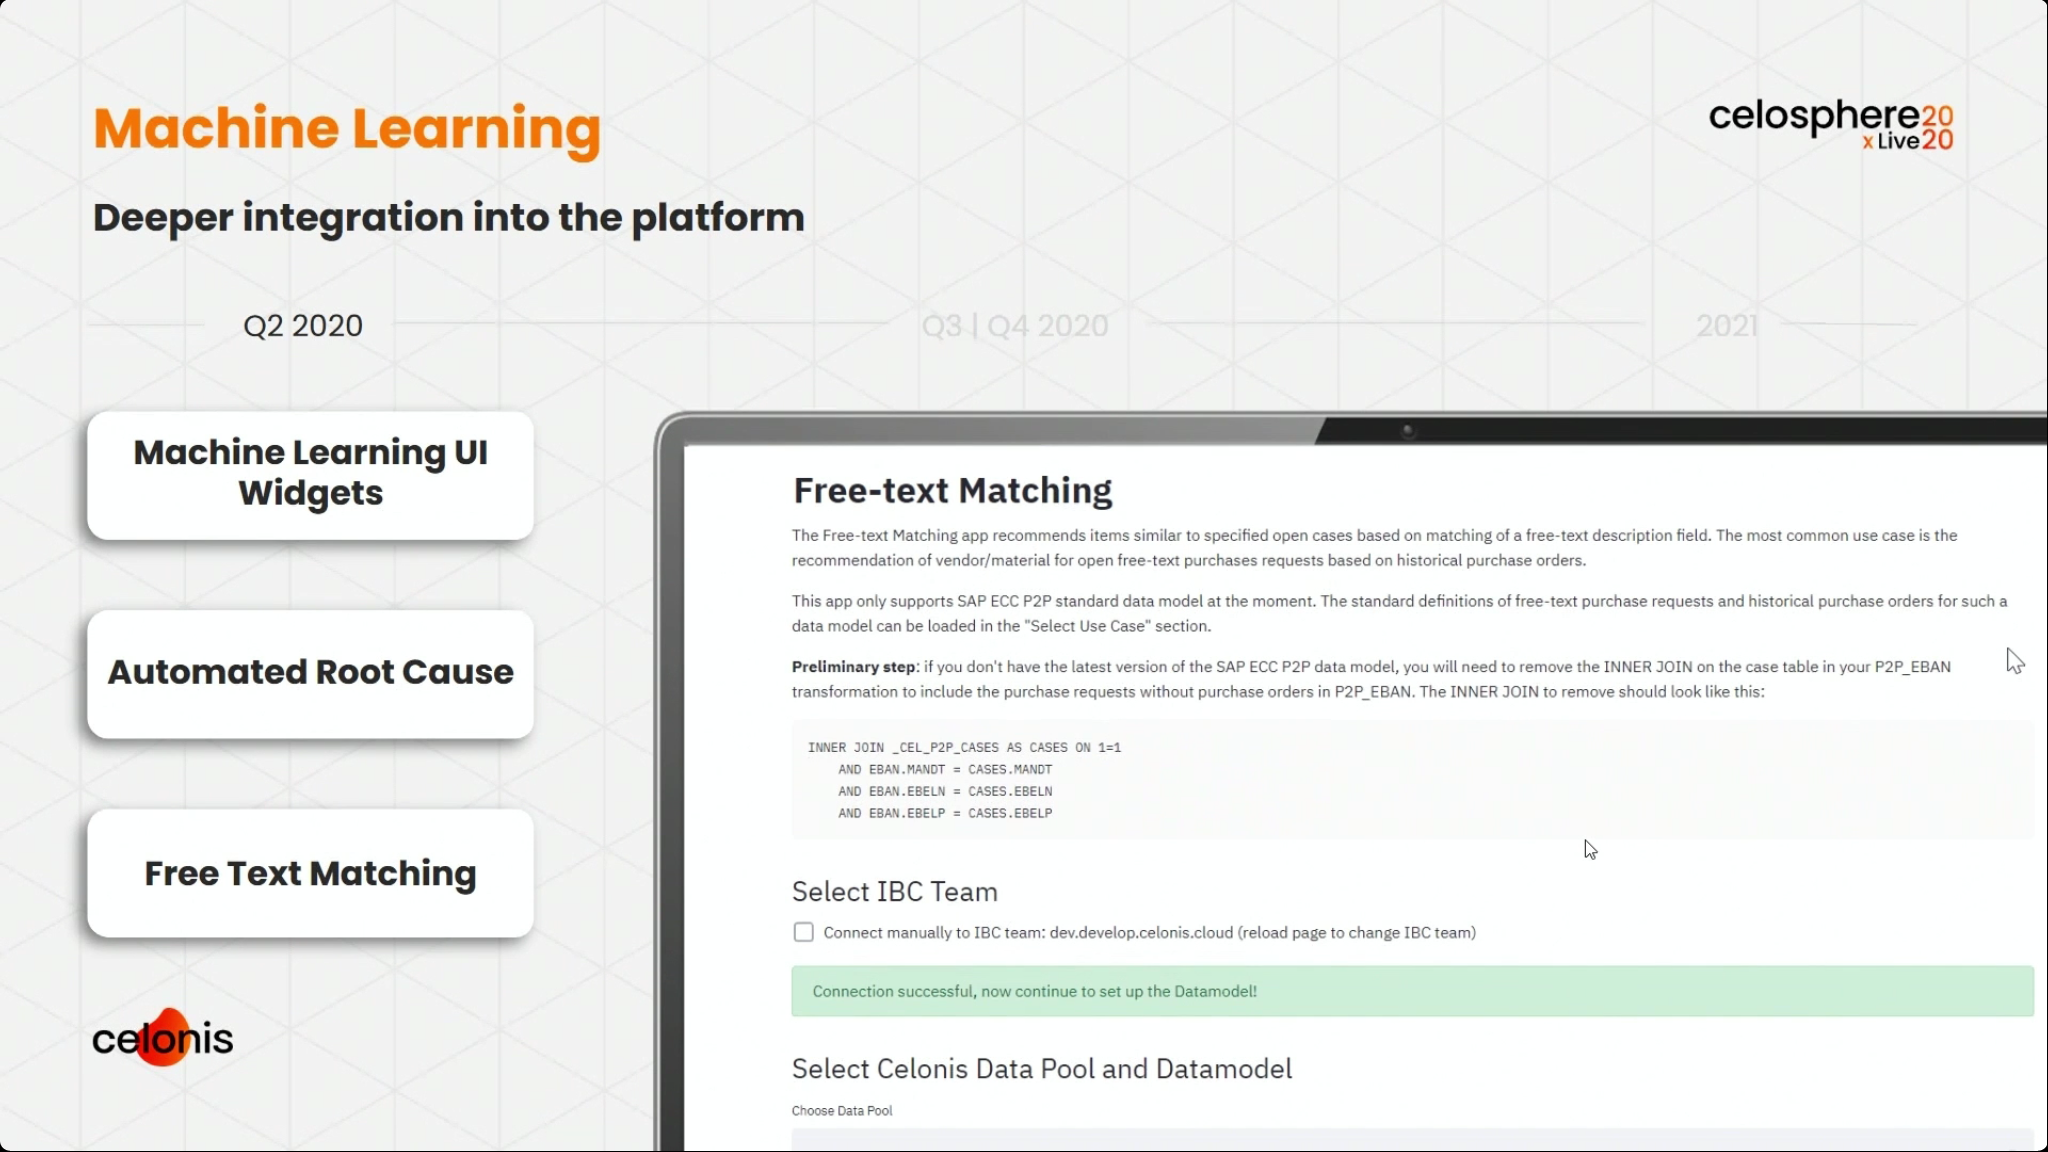
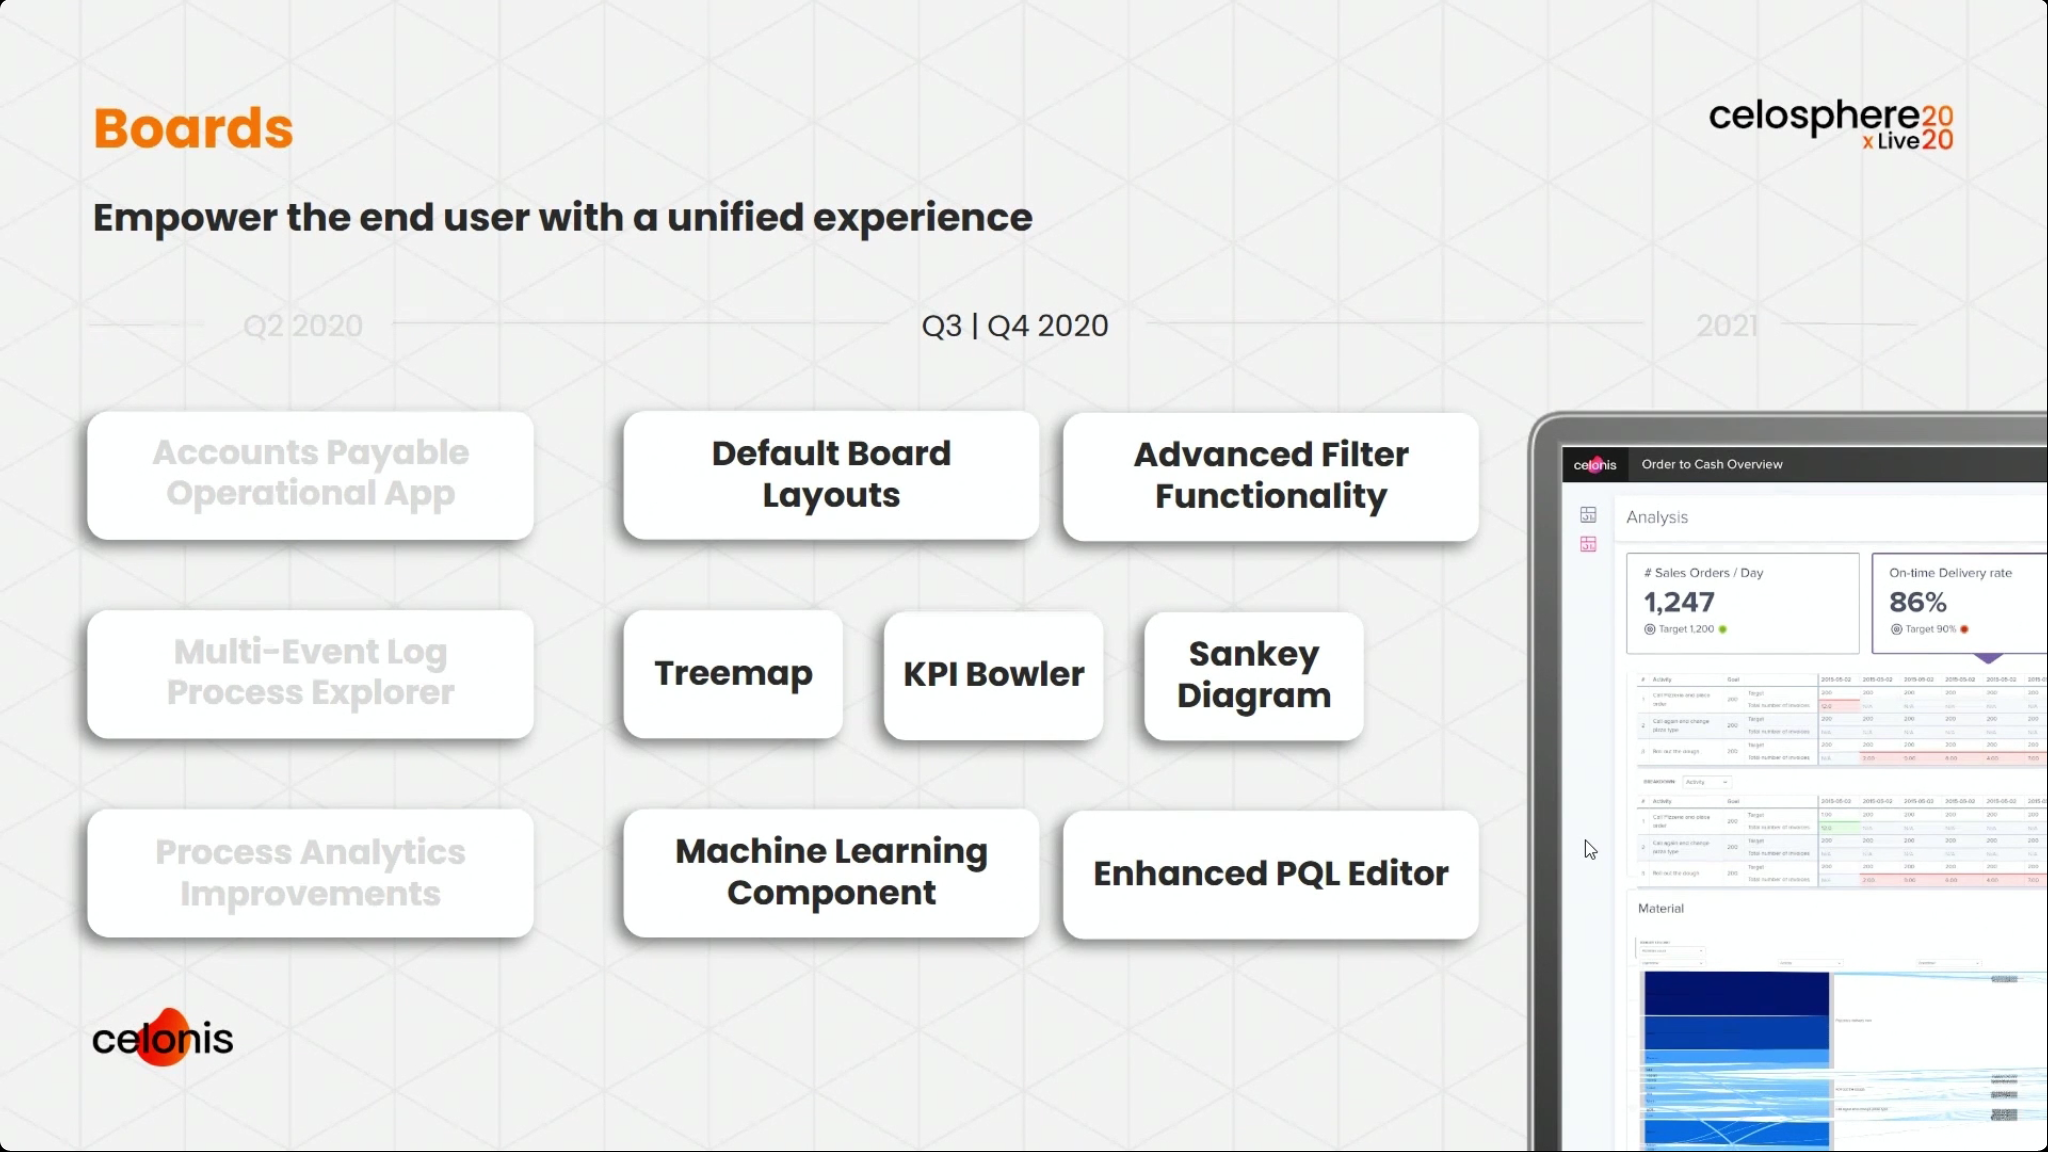
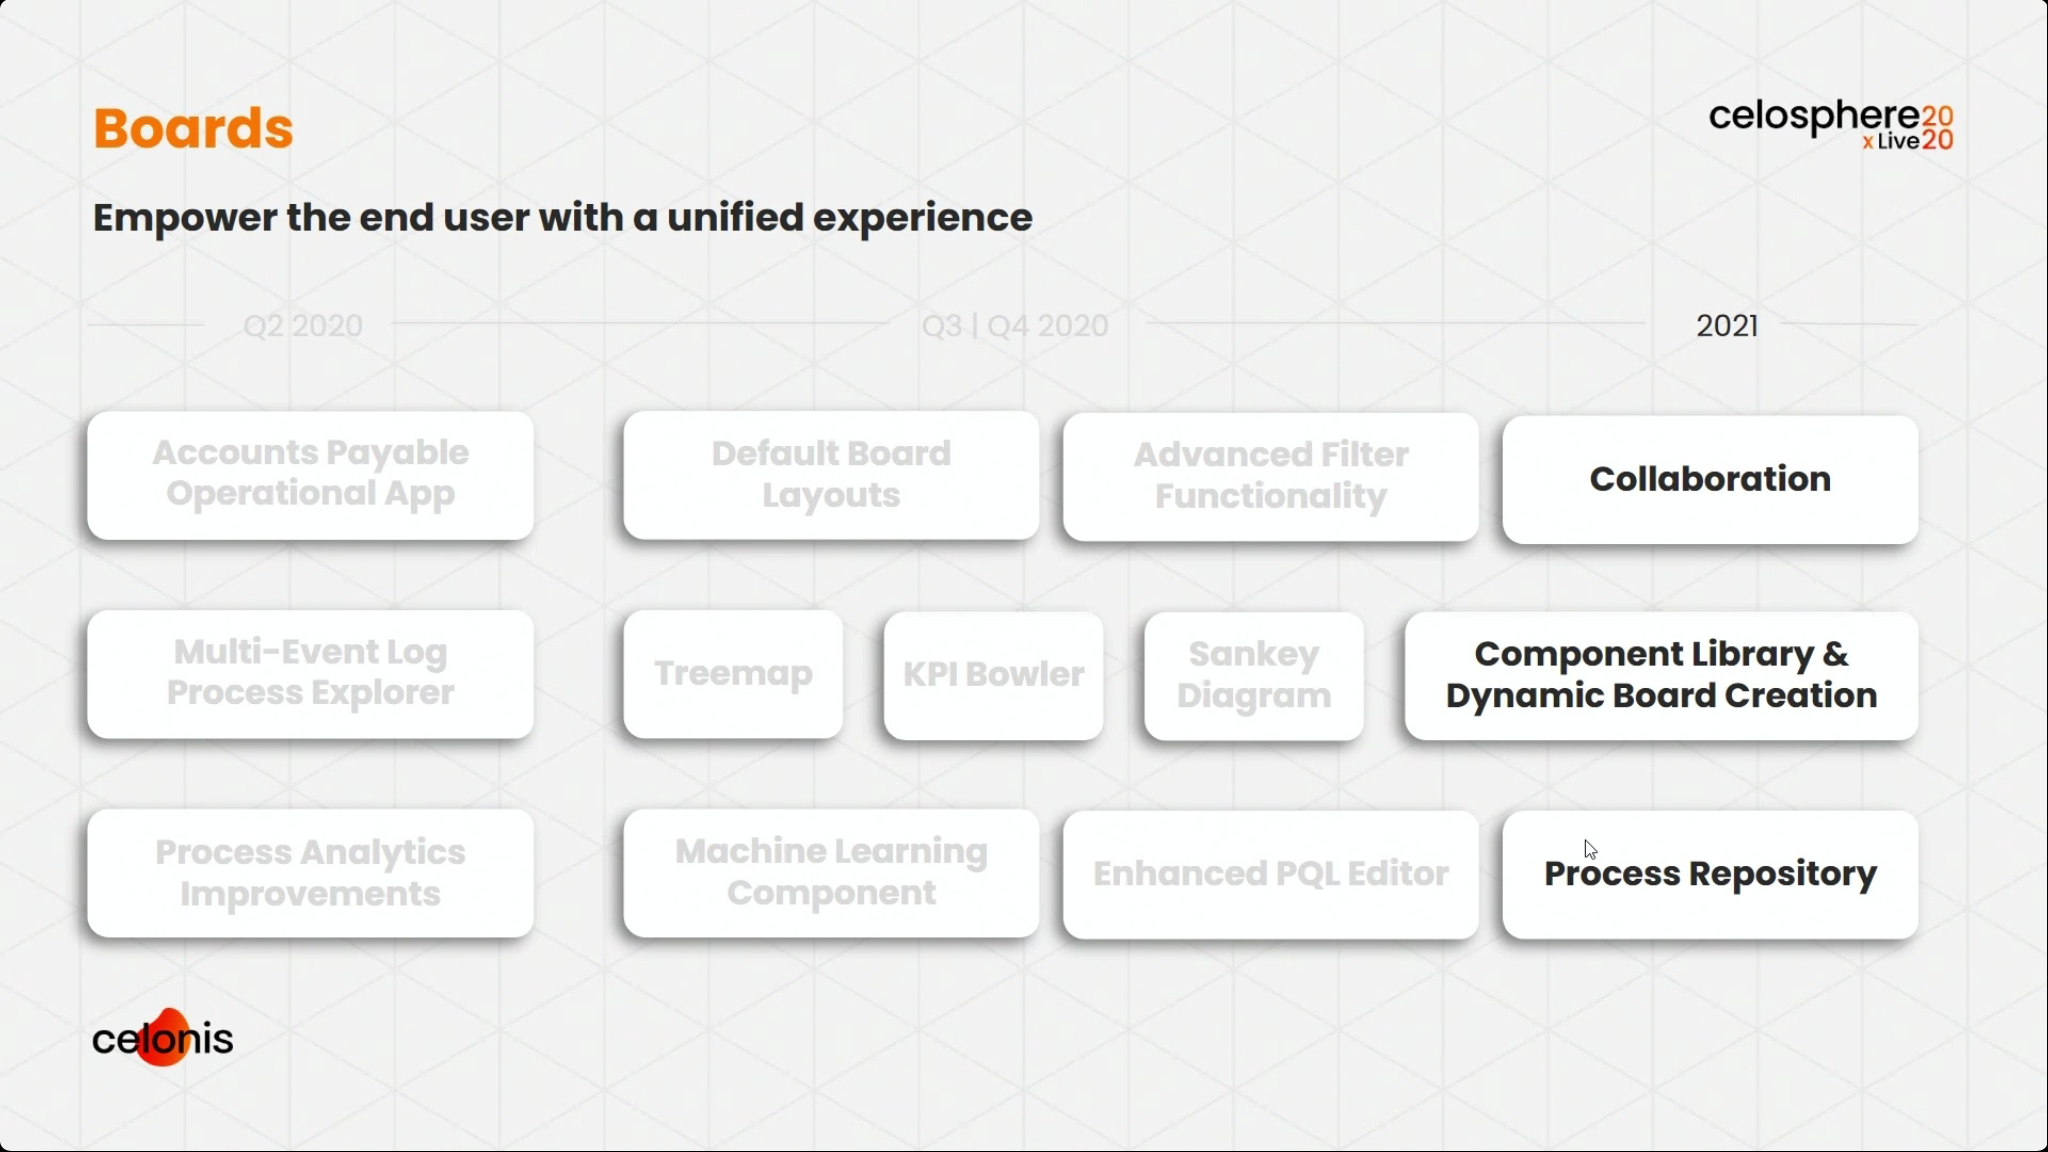
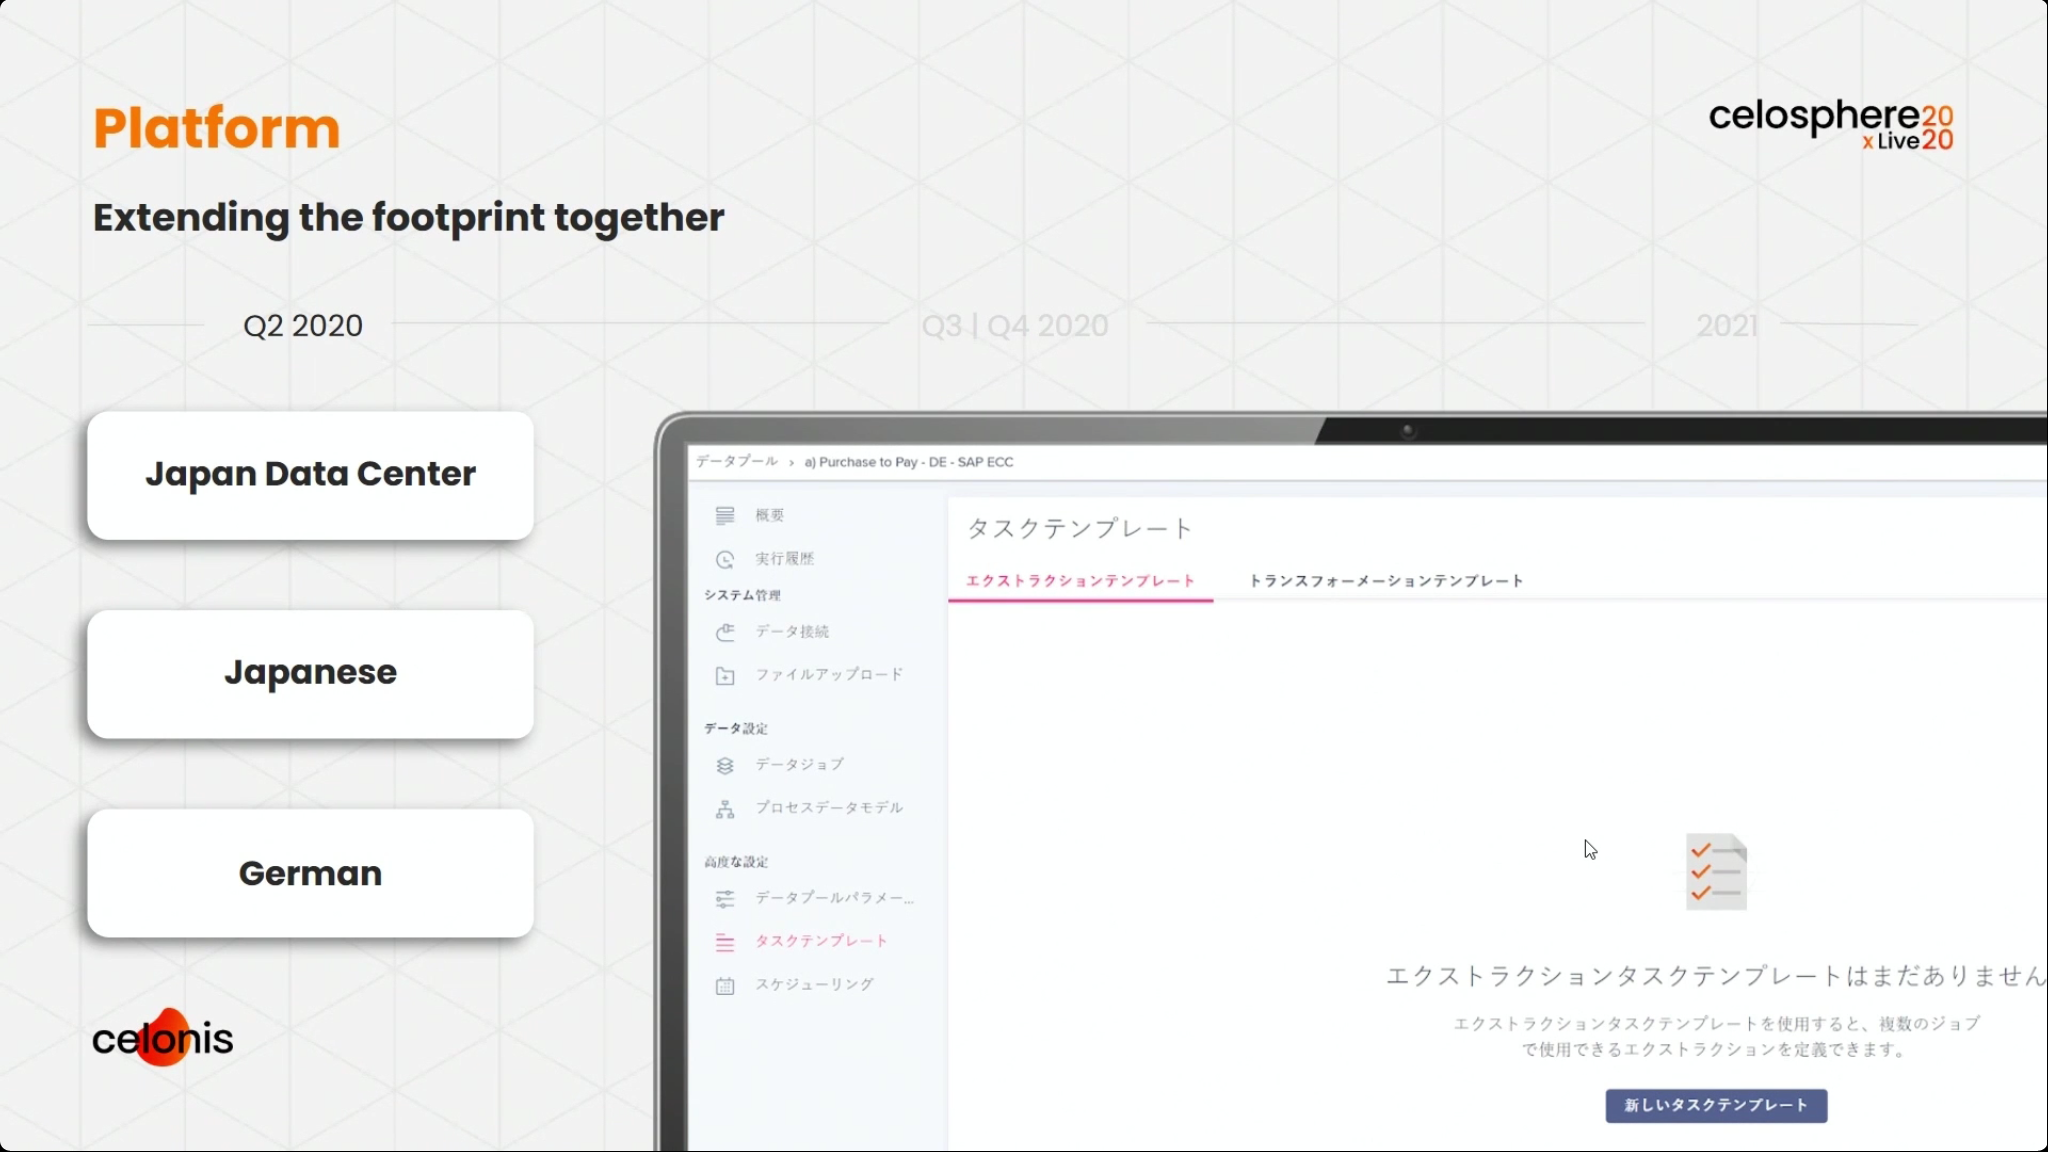
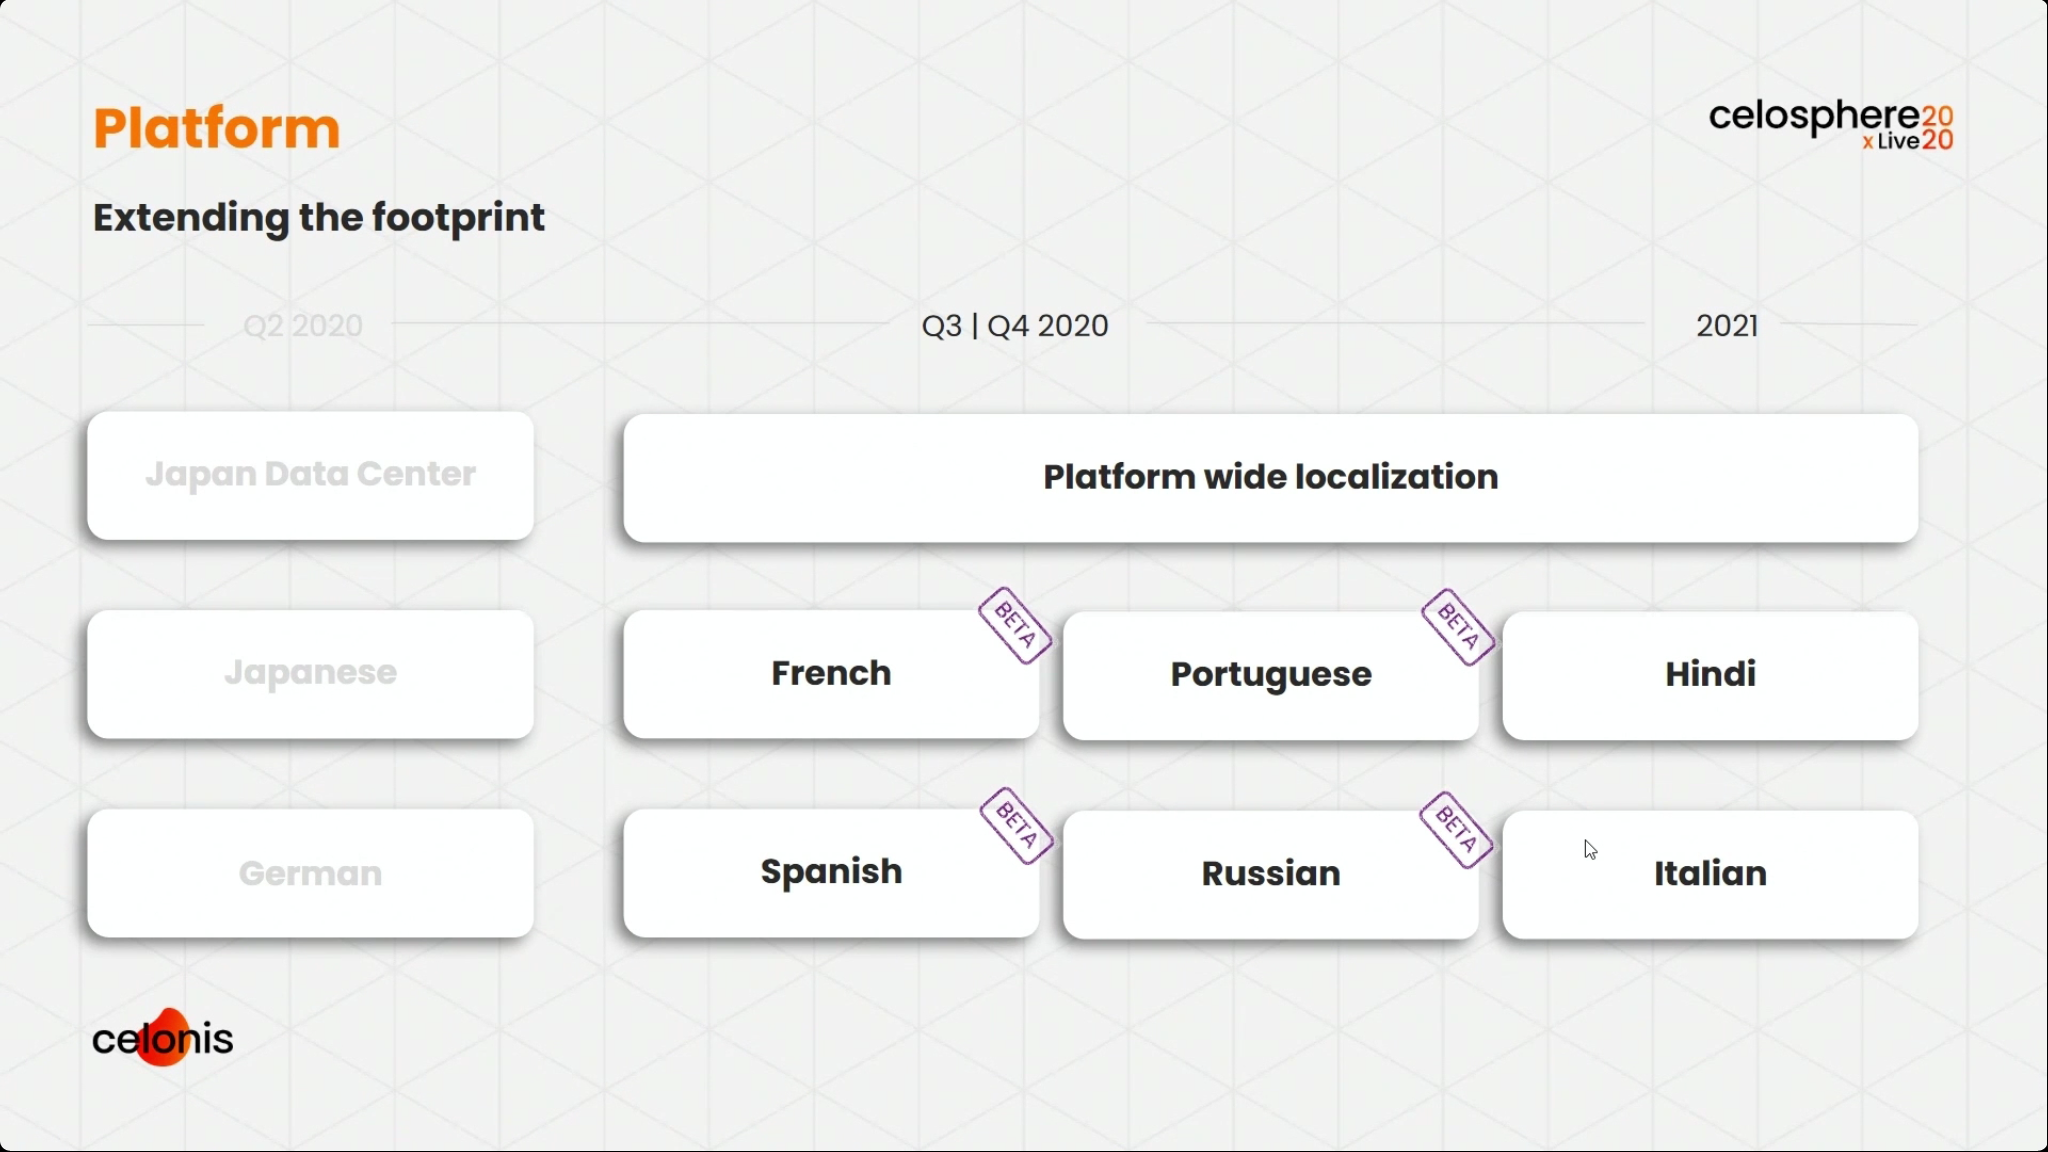
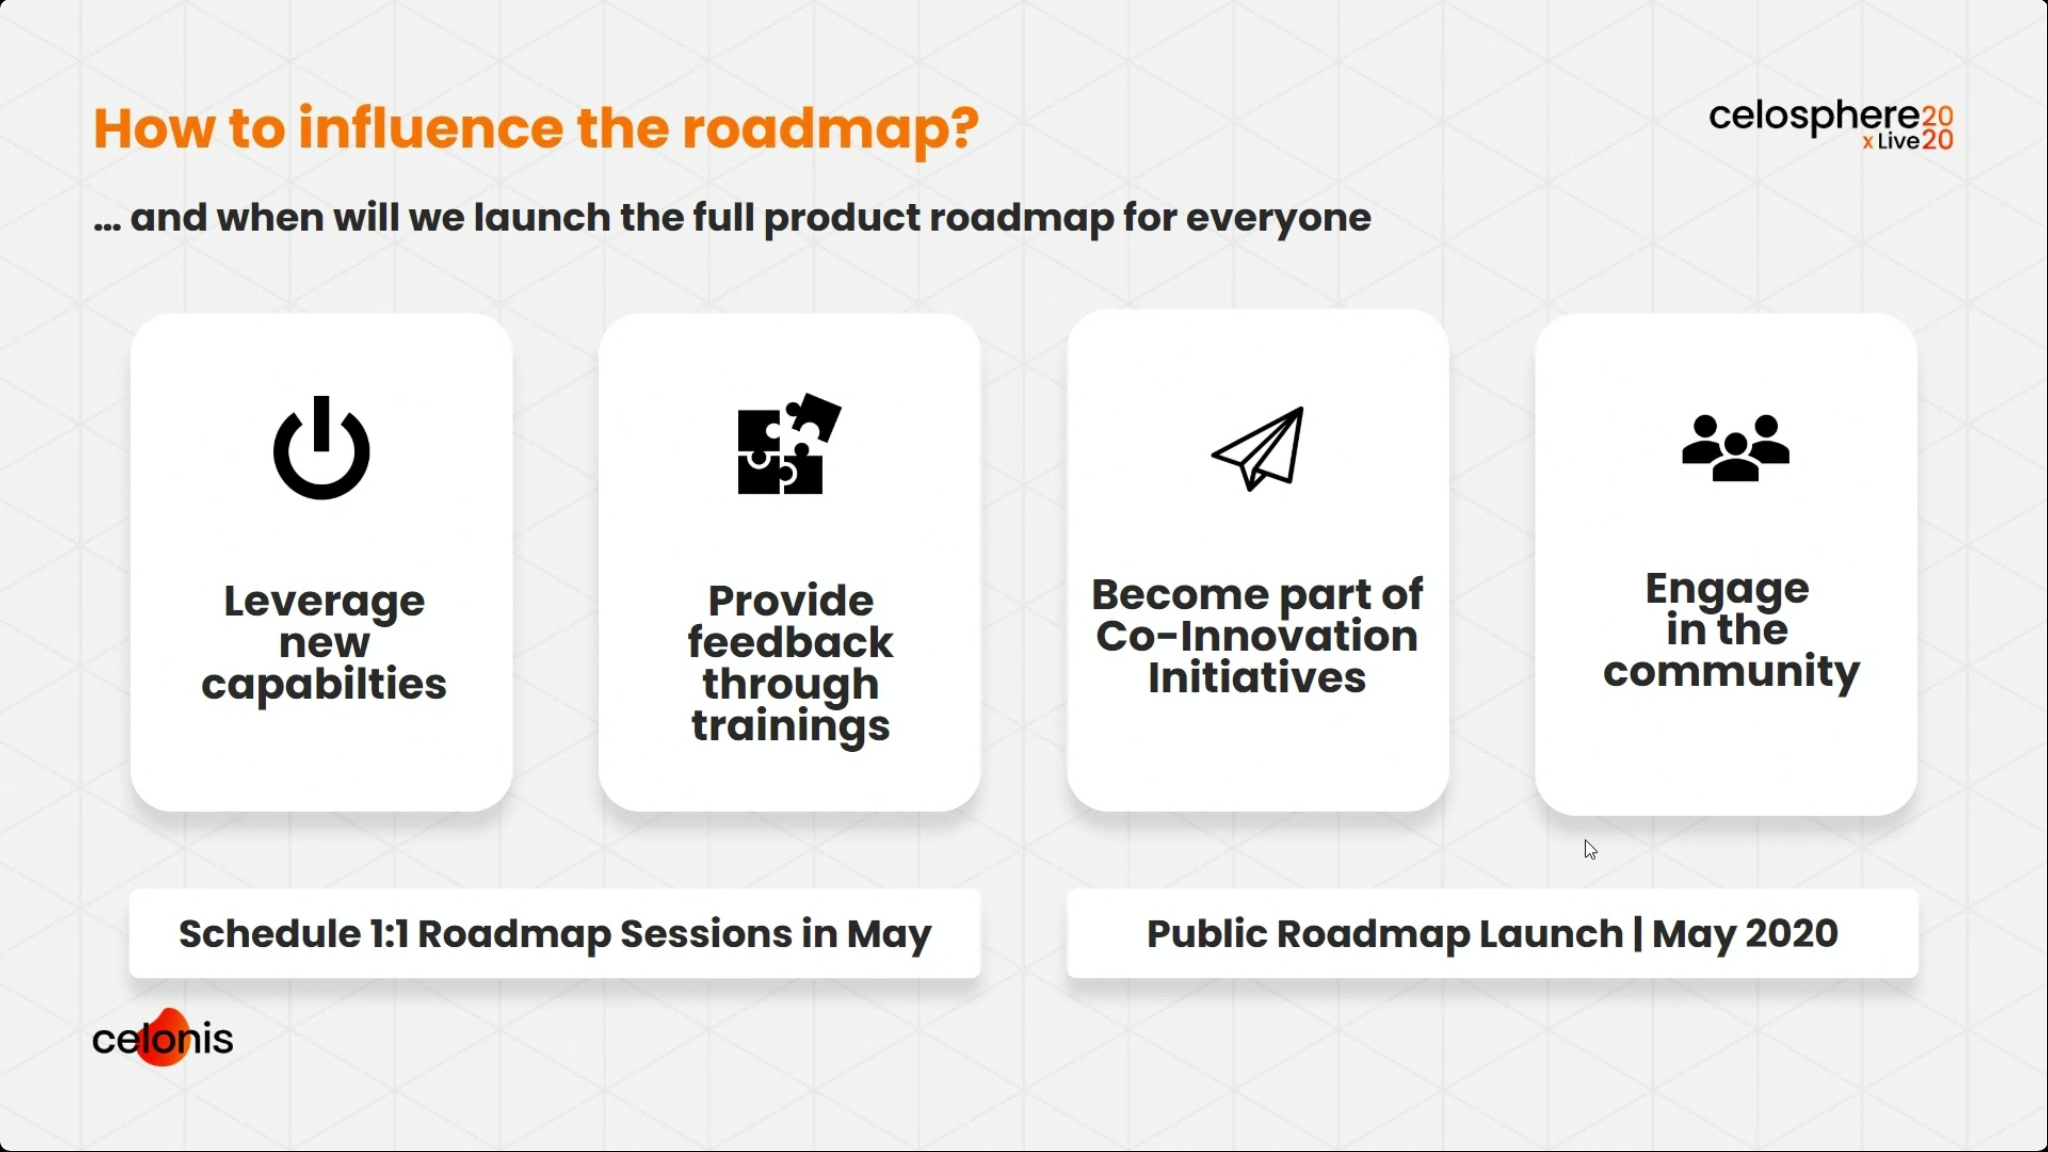
We broke into two tracks, and I attended the session with Michael Götz, Engineering Operations Officer at Celonis, providing a product roadmap. He highlighted their new operational apps, and how they collaborated with customers to create them from real use cases. There is a strong theme of moving from just analytical apps to operational apps that sense and act. He walked through a broad set of the new and upcoming features, starting with data and connectivity, through the process AI engine, and on to boards and the operational apps. I’ve shown some of his slides that I captured below, but if you’re a Celonis customer, you’ll want to watch this presentation and hear what he has to say about specific features. Pretty exciting stuff.
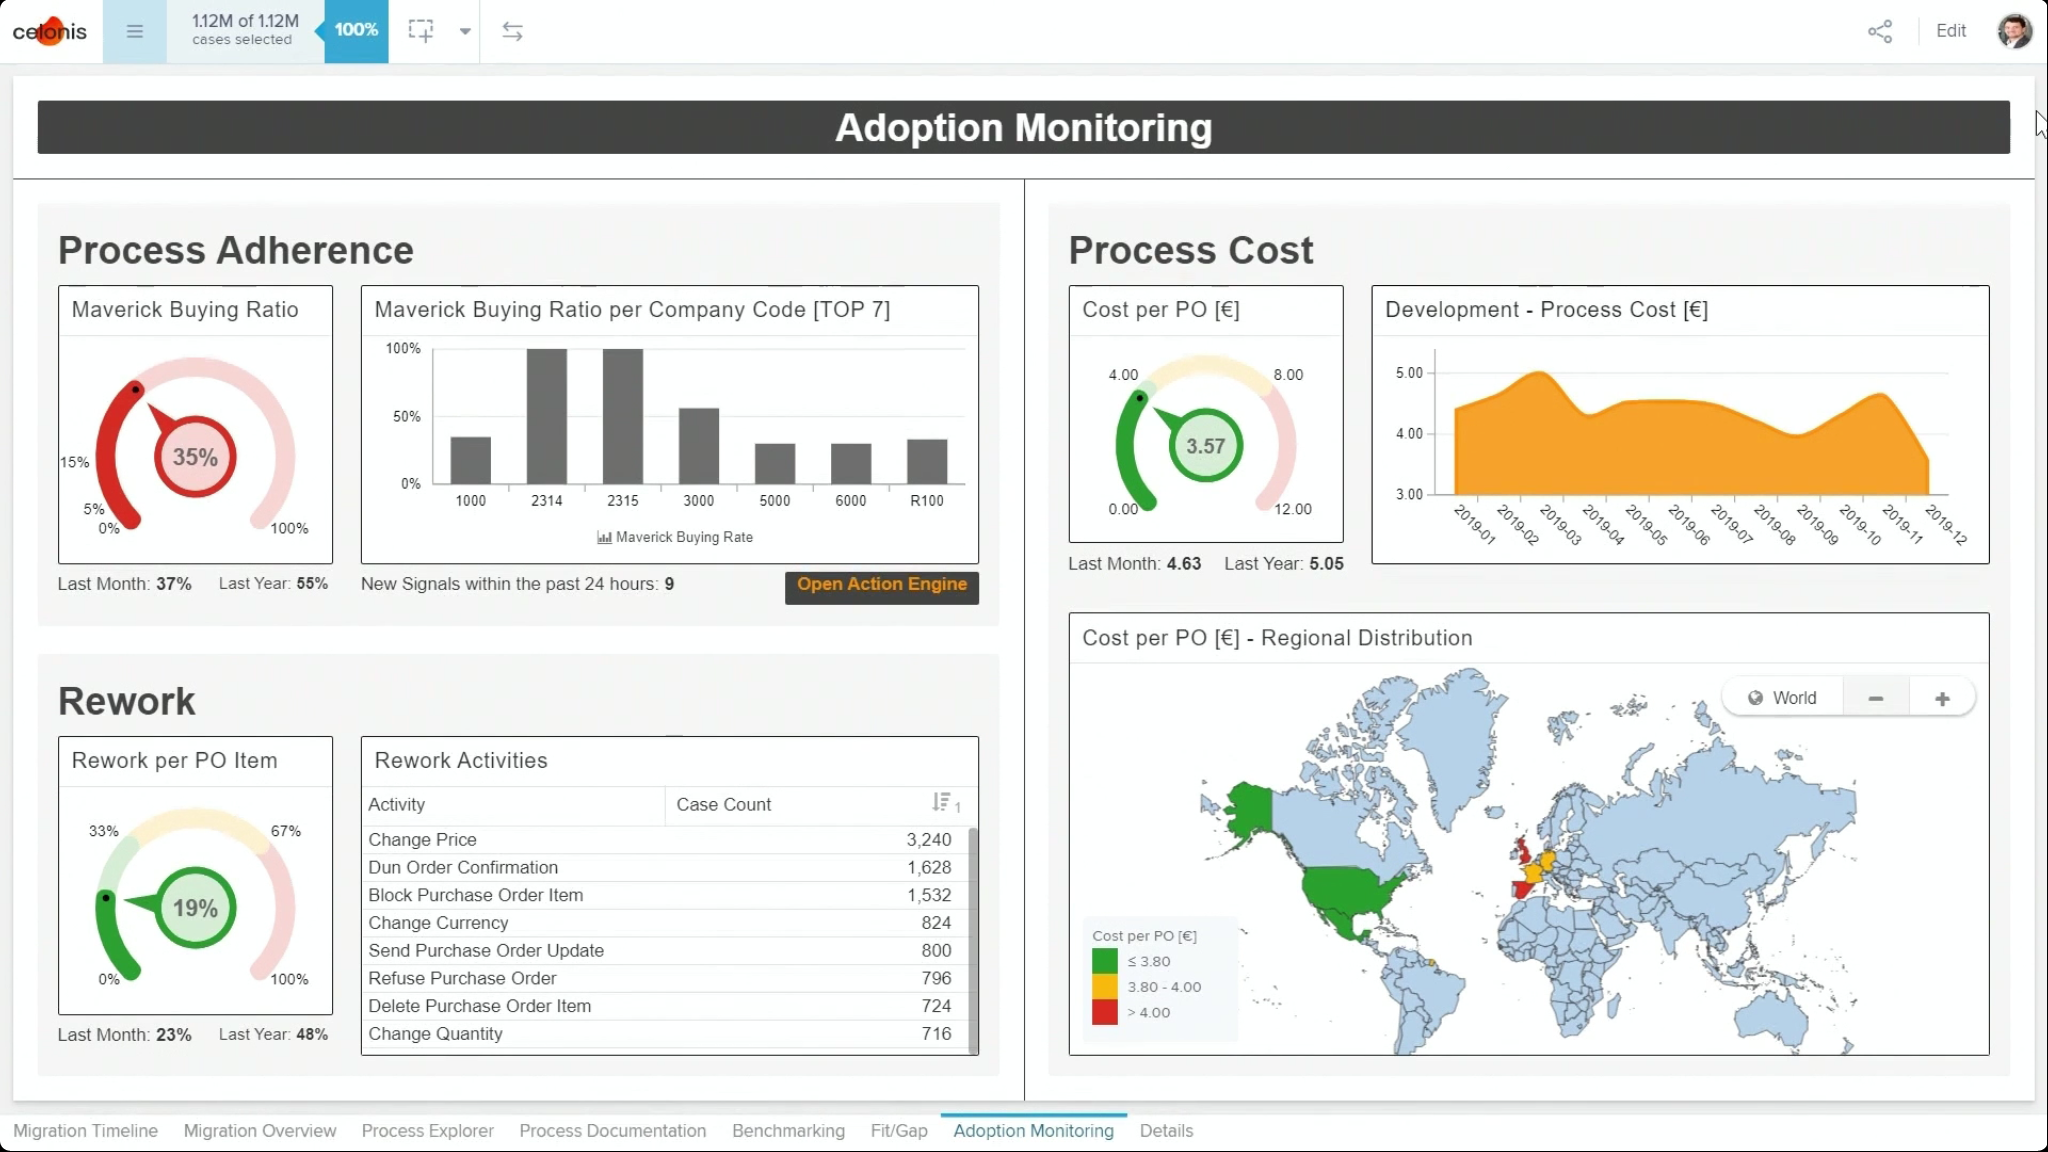
I skipped the full-length Uber customer presentation to see the strategies for how to leverage Celonis when migrating legacy systems such as CRM or ERP, presented by Celonis Data Scientist Christoph Hakes. As he pointed out, moving between systems isn’t just about migrating the data, but it also requires changing (and improving) processes . One of the biggest areas of risk in these large-scale migrations is around understanding and documenting the existing and future-state processes: if you’re not sure what you’re doing now, then likely anything that you design for the new system is going to be wrong. 60% of migrations fail to meet the needs of the business, in part due to that lack of understanding, and 70% fail to achieve their goals due to resistance from employees and management. Using process mining to explore the actual current process and — more importantly — understand the variants means that at least you’re starting from an accurate view of the current state. They’ve created a Process Repository for storing process models, including additional data and attachments
Hakes moved on to talk about their redesign tools, such as process conformance checking to align the existing processes to the designed future state. After rollout, their real-time dashboards can monitor adoption to locate the trouble spots, and send out alerts to attempt remediation. All in all, they’ve put together a good set of tools and best practices: their customer Schlumberger saved $40M in migration costs by controlling the migration costs, driving user adoption and performing ongoing optimization using Celonis. Large-scale ERP system migration is a great use case for process mining in the pre-migration and redesign areas, and Celonis’ monitoring capabilities also make it valuable for post-migration conformance monitoring.
The last session of the day was also a dual track, and I selected the best practices presentation on how to get your organization ready for process mining, featuring Celonis Director of Customer Success Ankur Patel. The concurrent session was Erin Ndrio on getting started with Celonis Snap, and I covered that based on a webinar last month. Patel’s session was mostly for existing customers, although he had some good general points on creating a center of excellence, and how to foster adoption and governance for process mining practices throughout the organization. Some of this was about how a customer can work with Celonis, including professional services, training courses, the partner network and their app store, to move their initiatives along. He finished with a message about internal promotion: you need to make people want to use Celonis because they see benefits to their own part of the business. This is no different than the internal evangelism that needs to be done for any new product and methodology, but Patel actually laid out methods for how some of their customers are doing this, such as road shows, hackathons and discussion groups, and how the Celonis customer marketing team can help.
He wrapped up with thoughts on a Celonis CoE. I’m not a big fan of product-specific CoEs, instead believing that there should be a more general “business automation” or “process optimization” CoE that covers a range of process improvement and automation tools. Otherwise, you tend to end up with pockets of overlapping technologies cropping up all over a large organization, and no guidance on how best to combine them. I wrote about this in a guest post on the Trisotech blog last month. I do think that Patel had some good thoughts on a centralized CoE in general to support governance and adoption for a range of personas.
I will check back in for a few sessions tomorrow, but have a previous commitment to attend Alfresco Modernize for a couple of hours. Next week is IBM Think Digital, the following week is Appian World, then Signavio Live near the end of May, so it’s going to be a busy few weeks. This would normally be the time when I am flying all over to attend these events in person, and it’s nice to be able to do it from home although some of the events are more engaging than others. I’m gathering a list of best practices for online conferences, including the things that work and those that don’t, and I’ll publish that after this round of virtual events. So far, I think that Camunda and Celonis have both done a great job, but for very different reasons: Camunda had much better audience engagement and more of a “live” feel, while Celonis showed how to incorporate higher production quality and studio interviews to good effect, even though I think it’s a bit early to be having in-person interviews.
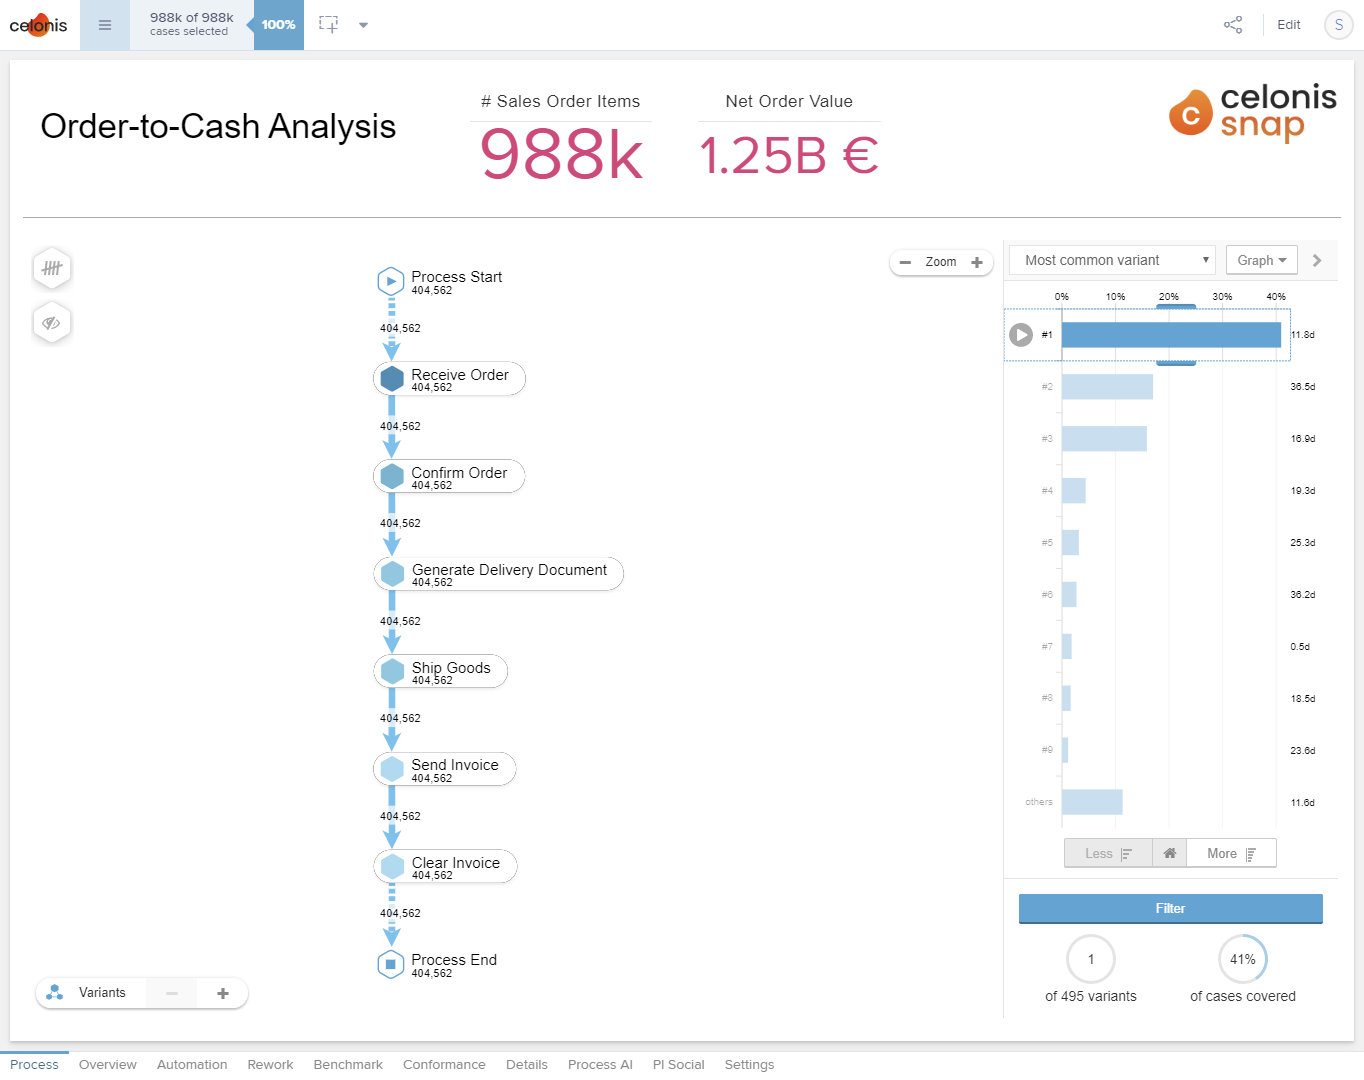
I attended a webinar today where Celonis showed Snap, the new free tier of their cloud-based process mining platform. It can work with flat files (CSV) or manually connect to ServiceNow, Google Sheets and a few other data sources directly, plus it supports teams for collaboration. You’re limited to uploading 500MB of data (which is a lot of records you’re uploading just case ID, activity name, resource, start and end time), and there’s no continuous data integration for event collection the way there is with their full-blown IBC Enterprise version; additionally, several functions from the main product are visible but not enabled. However, if you want to dip your toe into process mining with real-sized datasets, this is a good choice.
The process mining functionality is similar to what you see with competitive products, plus some nice dashboard capabilities for visualizing not just the overall discovered process flow, but for drilling into problem areas to do root cause analysis.
You can sign up for a free Celonis Snap account on their website. It self-deploys within a couple of minutes, creating a team account and setting you up as the admin, with the ability to add other users to the team. It doesn’t support everything in the paid platform, but definitely a good way to get started with process mining. There’s also an online community to ask (and answer) questions.
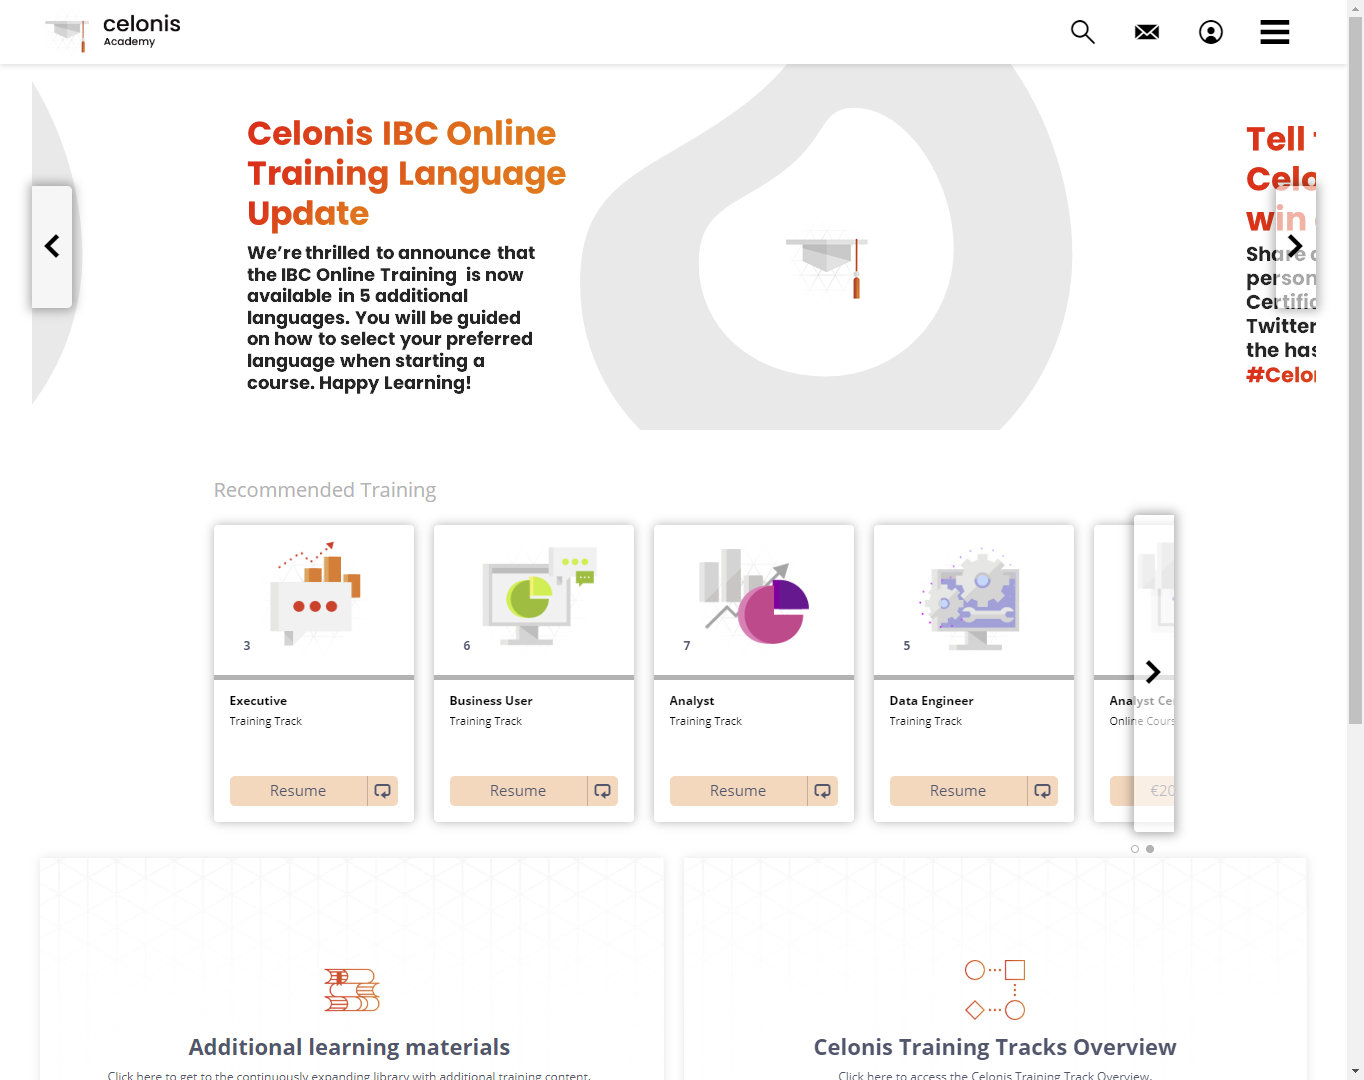
They are also offering free online training (not sure if that’s just now or if they will do this on an ongoing basis) that covers their full paid product suite; if you’re using Snap, the parts of the training related to process discovery and analysis will be relevant. They are launching free Snap-specific training next week, and adding new features to the product such as connectors to SAP Ariba. Obviously, they’d like to leverage free accounts into paid accounts, but this is more than just a 30-day trial or non-functional demo account; you can do some real work with the free version and move to the paid version when your data or processing needs exceed that.
Although technically a product breakout, the session on OpenText’s Digital Accelerants product collection was presented to the entire audience as our last full-audience session before the afternoon breakouts. This was split into three sections: cloud, AI and analytics, and process automation.
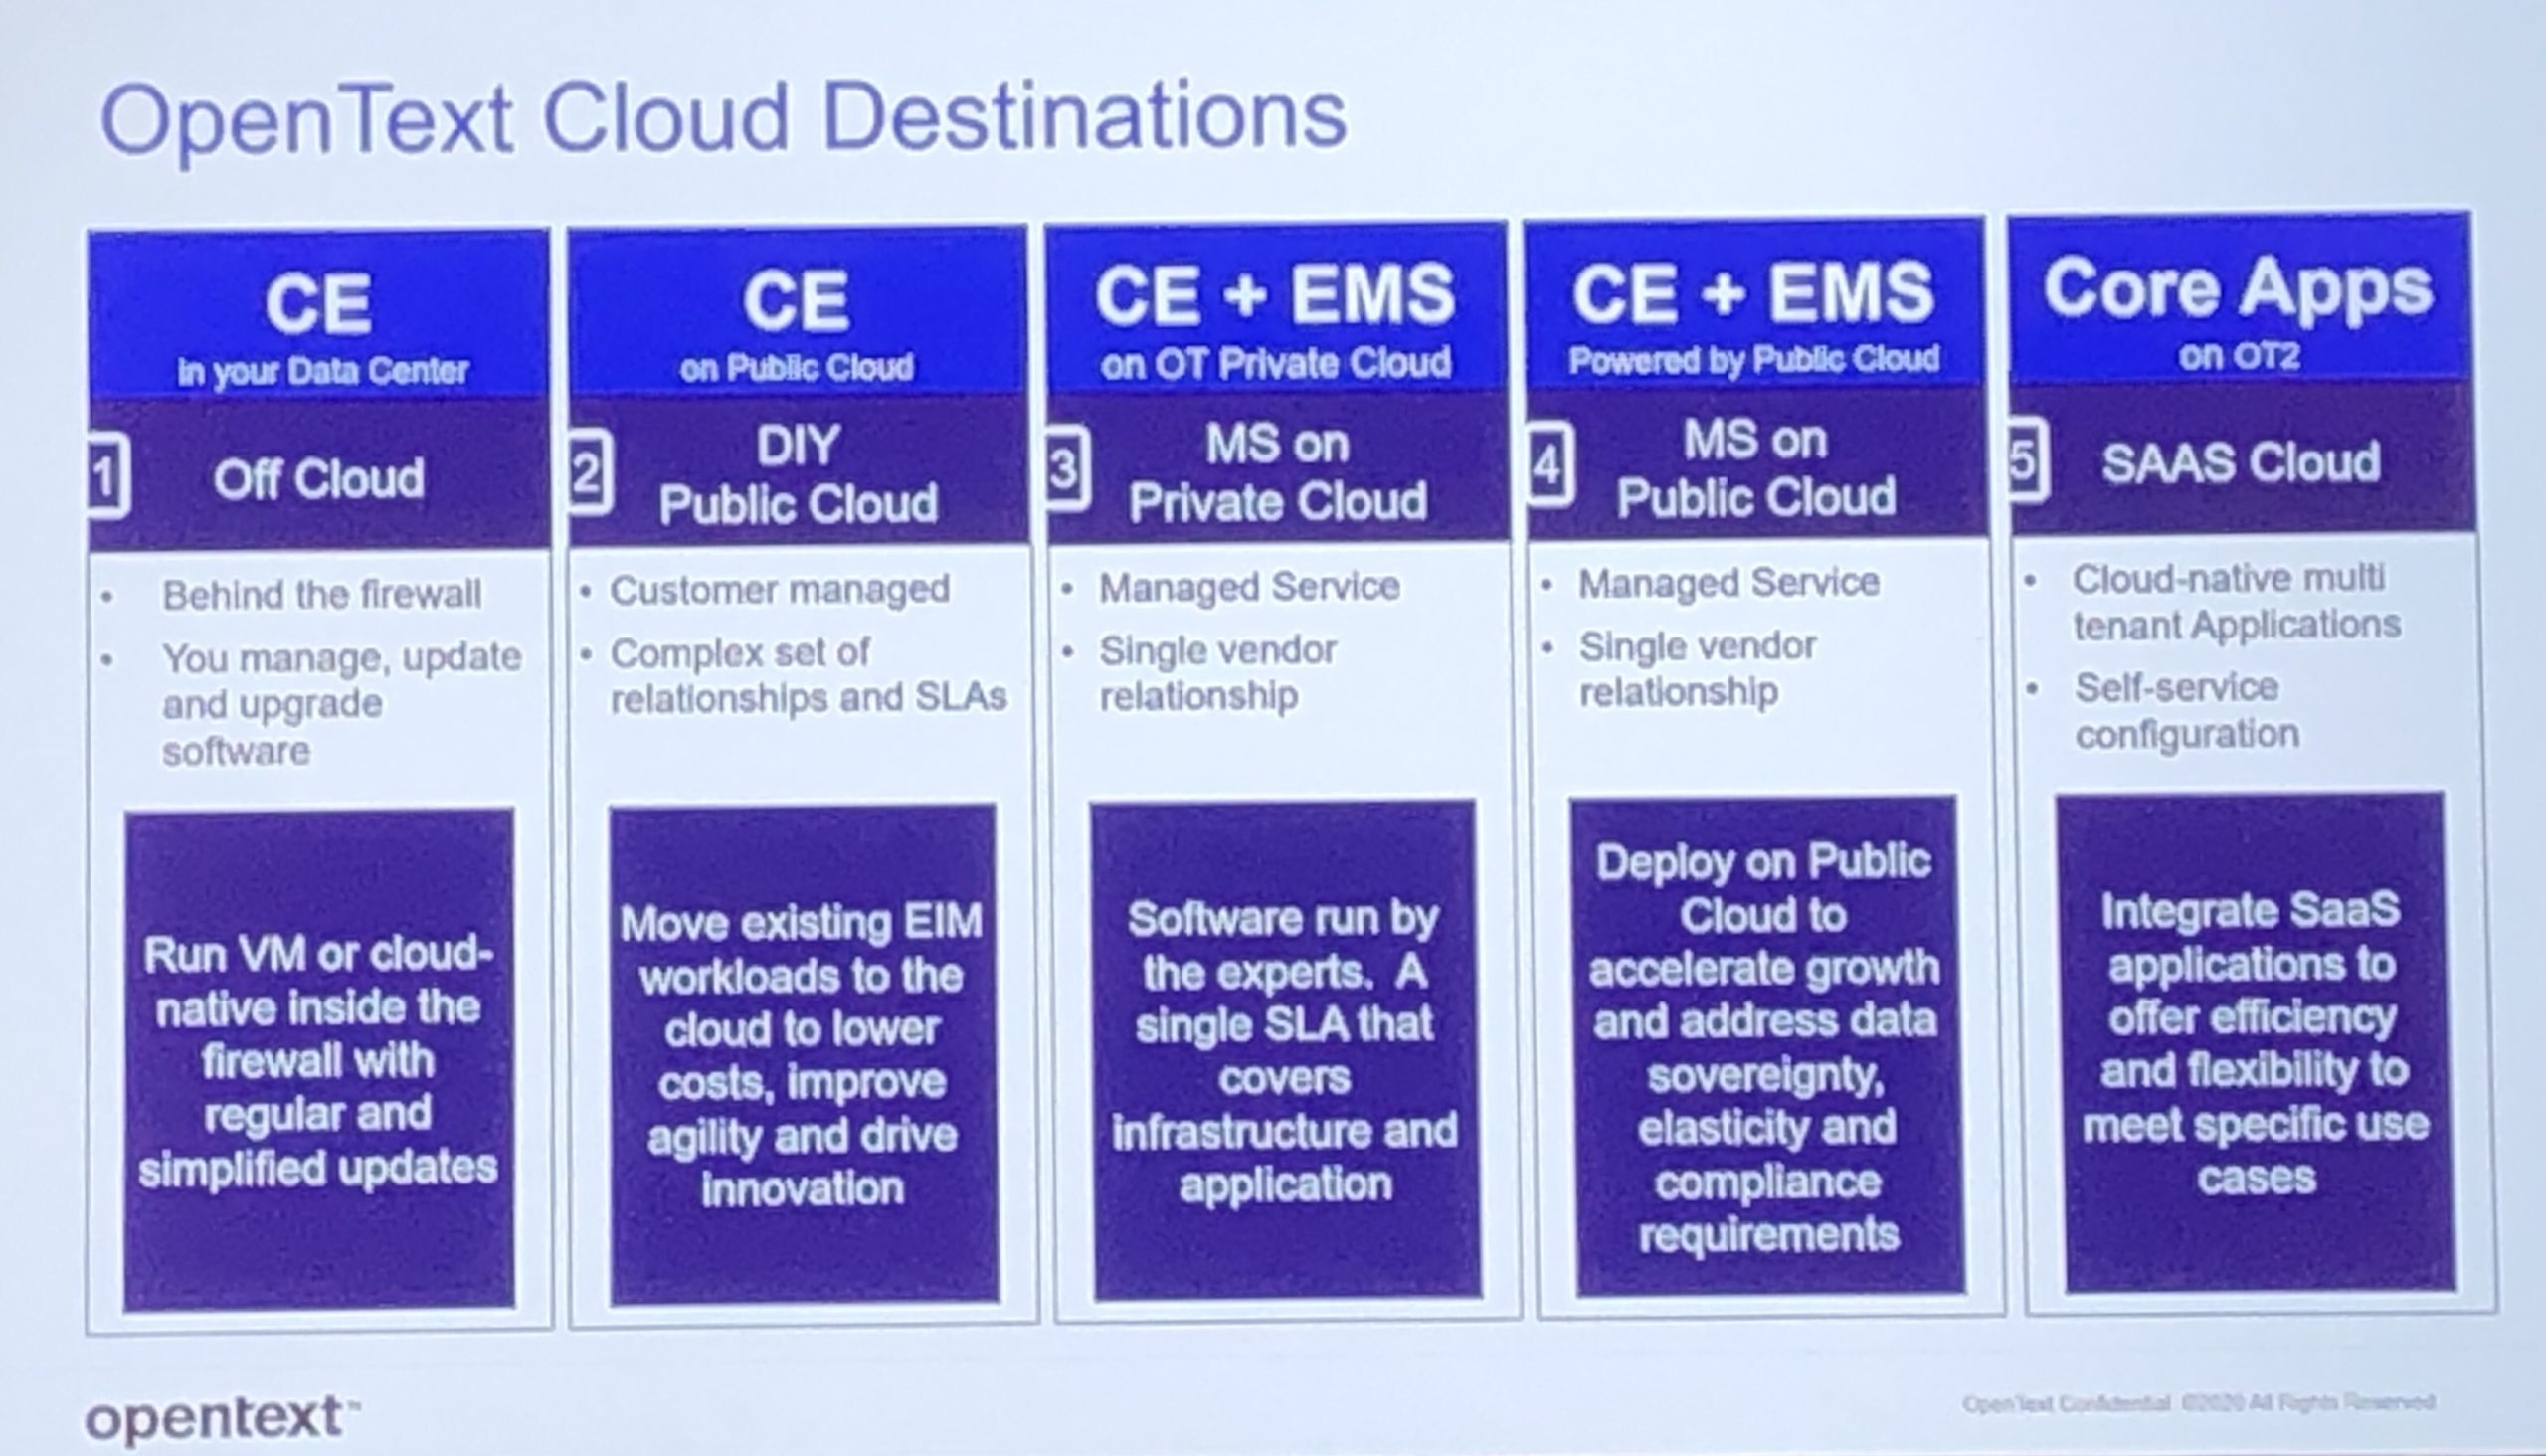
Jon Schupp, VP of Cloud GTM, spoke about how information is transforming the world: not just cloud, but a number of other technologies, a changing workforce, growing customer expectations and privacy concerns. Cloud, however, is the destination for innovation. Moving to cloud allows enterprise customers to take advantage of the latest product features, guaranteed availability, global reach and scalability while reducing their operational IT footprint. OpenText provides a number of different deployment platforms: “off-cloud” (aka on-premise), public cloud, private cloud, managed services, and SaaS.
Dave Moyers and Paul O’Hagan were up next to talk about AI and analytics, and how they are addressing data variety, ease of use, embedding AI/ML in processes, and deploying anywhere that it’s required. Their AI and analytics capabilities are provided by the Magellan product, and have been integrated with other OpenText products as well as built into vertical solutions. Magellan has been integrated into the ECM products with AI-augmented capture and the AI-powered “magic folder” auto-categorization and filing; into the Business Network products with asset performance optimization and predictive maintenance; into AppWords by instantiating processes based on insights; and several other integrations. They also have some new standard features for identifying PII (personal identifiable information), which is crucial for compliance and privacy. In addition to the analysis capabilities, there is a wide range of dashboard and visualization options, and full-fledged ETL for connecting to enterprise and third-party data sources and organize data flows. We also saw some examples yesterday of using Magellan for e-discovery and sentiment analysis. Interestingly, this is one of the product portfolios where they’ve taken advantage of integrating with open source tools to extend the core products.
Saving the best for last (okay, maybe that’s just my bias), Lori McKellar and Nick King presented on business process automation. This is not just about back-office automation, but includes customer-facing processing, IoT and other more complex intelligent processes. AppWorks, which includes the process automation capabilities, is an application development environment for use by semi-technical citizen developers (low-code) as well as professional developers (pro-code). We saw the all-new developer experience last year, and now they’ve had a chance to integrate the actual customer usage to fine-tune both the developer and end-user AppWorks experience. One significant change is that as their customers start to build larger apps, they now allow more granular access to the entities under development to allow multiple developers to be working on the same application simultaneously without collisions. They’ve added some new UI capabilities, such as a card view option and an optimized tablet view. Integration with Documentum has been improved for easier document check-in and repository access. Privacy features, including dynamic instance-level permissions and document redaction, are now available in AppWorks. In the upcoming 20.2 version, they’ll be adding an RPA connector framework, then expanding the RPA integrations in 20.3.
The session finished with a Q&A with all of the participants, including discussions on RPA connectors, operationalization of machine learning, hybrid cloud models, the role of unstructured content in AI training, and natural language processing.
This afternoon, I’ll be attending the breakout session on content services, so stay tuned for those final notes from the OpenText Analyst Summit 2020.
I’m in Boston for the next two days for OpenText’s annual analyst summit; Patty Nagle, CMO, kicked things off in the first session, then we had a keynote from CEO/CTO Mark Barrenechea. They’re coming up on 30 years in existence, which is definitely a milestone for any technology company, and they’ve grown to 15,000 employees in over 30 countries, in part through their pattern of growth through acquisition. They sell through a large direct salesforce, as well as through their 27,000 partners and directly from their website.
The latest acquisition is Carbonite, which seems a pretty good fit with their cloud/edge content strategy, and Barrenchea discussed where Carbonite fits into their strategy some detail: decentralized computing, small/medium business and consumer audience, and cyber-resilience. OpenText has promoted the term enterprise information management (EIM) in the past, and now are dropping the “E” to be just information management as they enter the smaller end of the market.
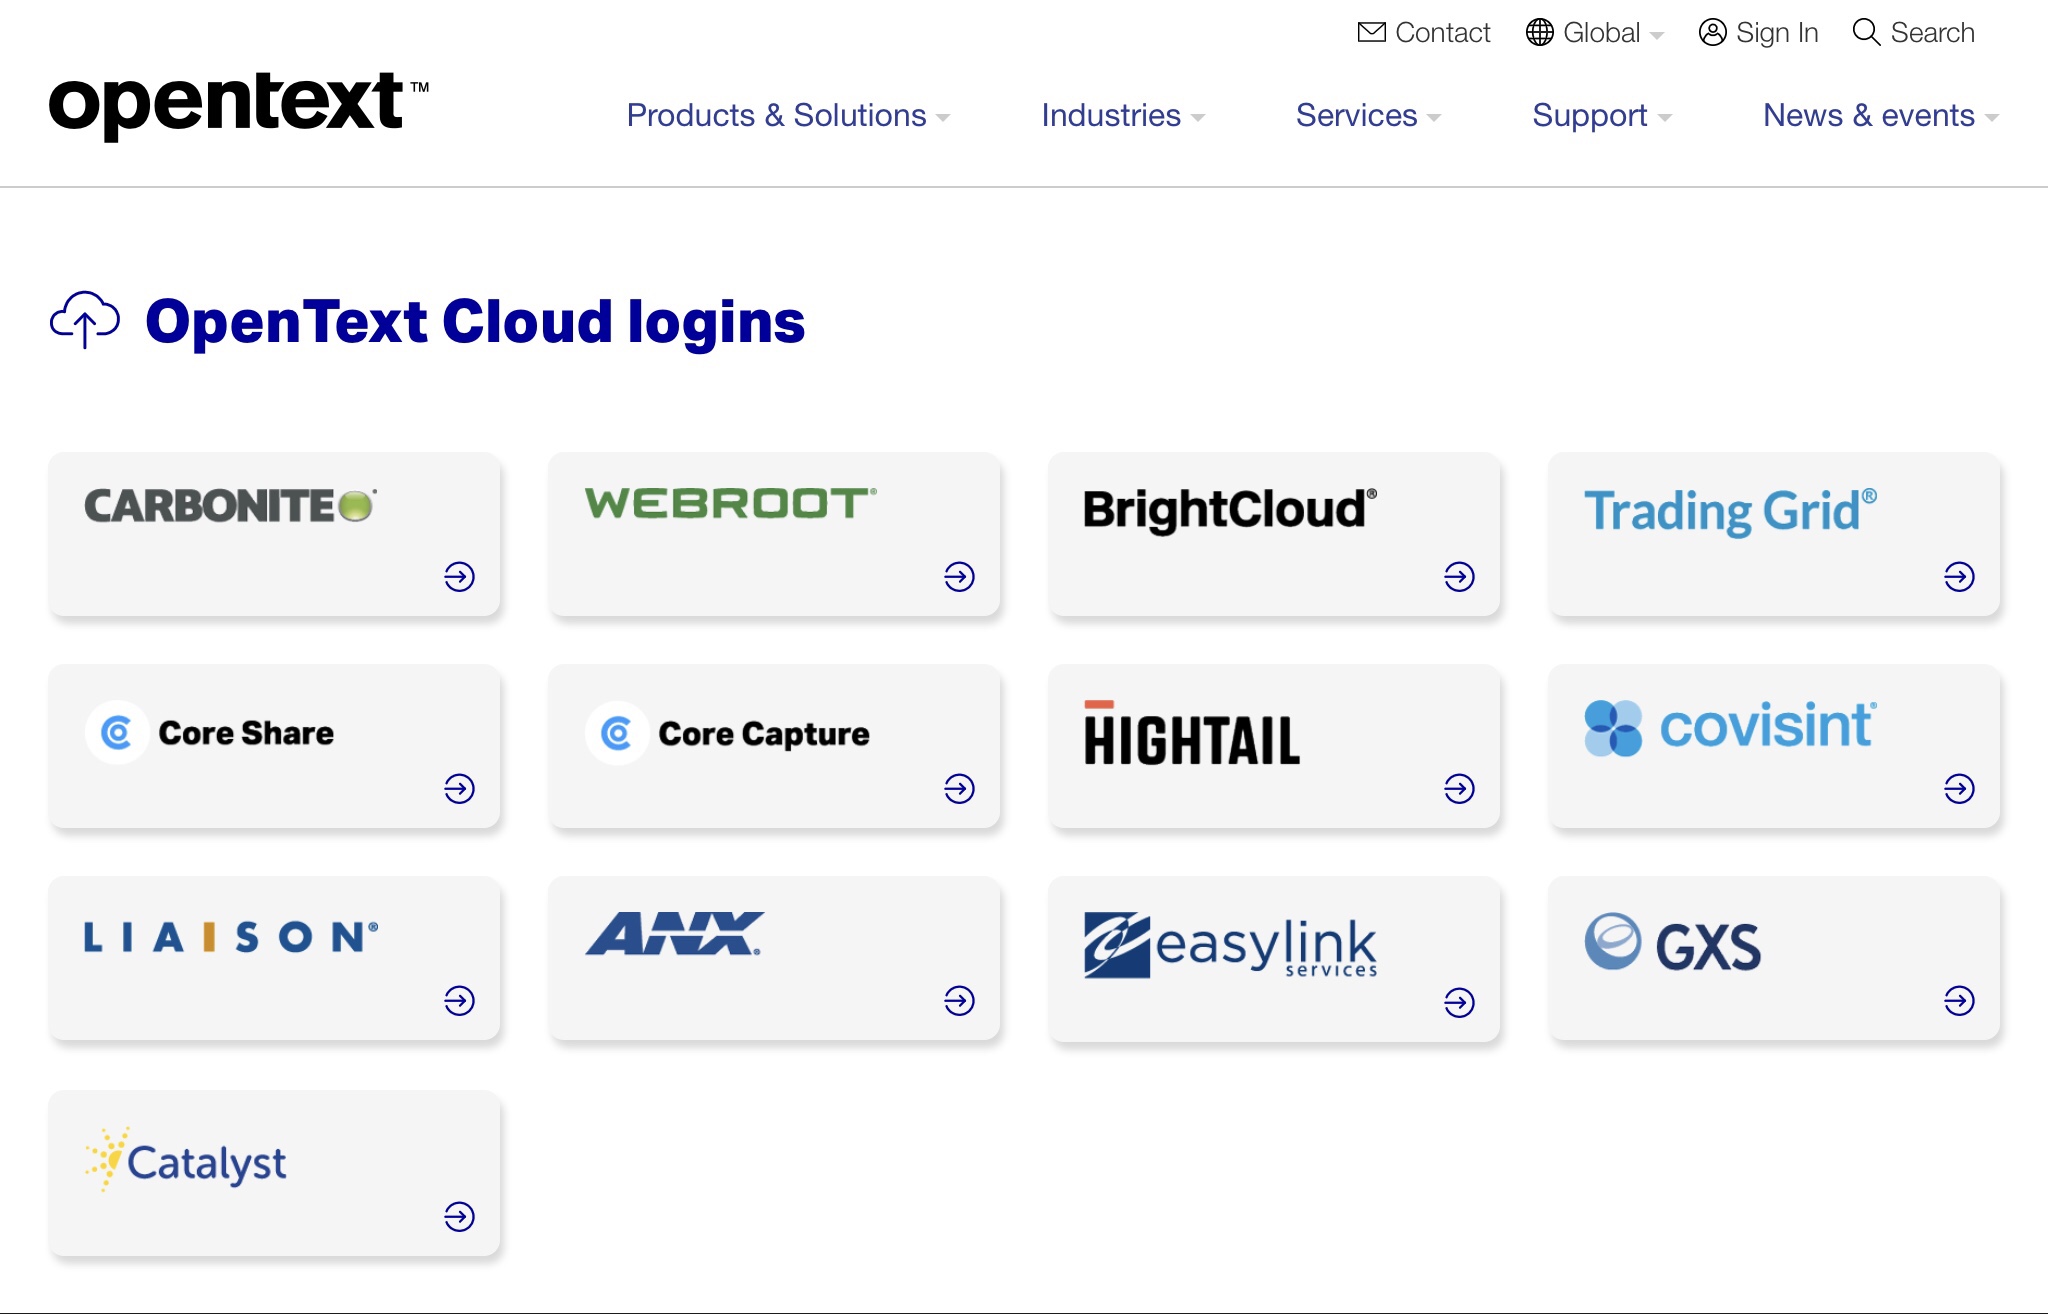
They are following the lead of smaller (arguably more nimble) vendors with a move to quarterly product releases for their core content management, and their product versioning will reflect that with a YY.Q version number (e.g., 20.2). Their release 16 will become Cloud Edition 20.2 with the April release, with OT2 and Business Network following the same version numbering. The push to the cloud continues, and if you go to their website now, you’ll see a link to their cloud logins. I’m not sure that having quite so many different logins is a good thing, but I get that there are different audiences for this.
He also covered their business network and cyber resilience offerings, which are a bit peripheral to my interests; then on to their digital accelerants, which is a mixed bag of capabilities including low-code development, AI, IoT, process automation and analytics. They showed a demo of Magellan analytics visualizing World Health Organization data on COVID-19 — a timely example — showing the trends of the disease spread in human healthcare terms, but also the impact on business and markets.
Their key corporate priorities include maintaining market leadership in information management, with expansion to all size of customers; continued move to the cloud; and becoming more of an applications company. I’ve seen a few horizontal technology vendors fail spectacularly on building applications, so it will be interesting to see what they can accomplish there.
We heard briefly about BrightCloud Threat Intelligence, part of the Carbonite acquisition, and saw a demonstration of the Webroot BrightCloud Threat Investigator. Webroot was only acquired by Carbonite less than a year ago, and the branding didn’t even have time to change to Carbonite before becoming part of OpenText. OpenText plans to integrate this into their other offerings to provide better security for content and access to third-party sites and services.
Barrenechea ended with a call to arms to address climate change, ethical supply chains, overuse of plastics and other issues threatening society at large. Not what you usually hear from a technology CEO, but they are pushing a brand of “technology for the good”.
Ted Harrison, EVP of sales, finished the session by hosting a customer panel featuring Peter Chen of Stericycle, Shyam Pitchaimuthu of Chevron, and Gurreet Sidhu of BMO Financial Group. Stericycle and Chevron are both OpenText content management customers, with broad usage across their organizations and deep integration into other systems and processes. BMO is using the OpenText Trading Grid for B2B payment solutions, and appreciate the elastic scalability of the platform as business sectors expand and contract. Stericycle and Chevron both moved to cloud content management as part of their cloud-first strategy, with Chevron doing a conversion from on-premise Documentum to Azure. BMO went with OpenText’s managed services to allow them greater customization and security without running the core infrastructure themselves. Good discussion of how they’re using OpenText products, and the transition to their current state.


")
")
")
")
")